Skip to content
New issue

Have a question about this project? Sign up for a free GitHub account to open an issue and contact its maintainers and the community.

By clicking “Sign up for GitHub”, you agree to our terms of service and privacy statement. We’ll occasionally send you account related emails.

Already on GitHub? Sign in to your account

Grafana proxy queries timeout after 30s with dataproxy.timeout and dataproxy.keep_alive_seconds to > 30s #35505

Closed
morvencao opened this issue Jun 10, 2021 · 11 comments
Labels
needs more info Issue needs more information, like query results, dashboard or panel json, grafana version etc

Comments

@morvencao
Copy link

What happened:

Relevant to #27839
Long running queries to thanos are failed after 30 seconds with a 504 Gateway timeout issue despite dataproxy.timeout and dataproxy.keep_alive_seconds set to >30s when run behind a network proxy.

[dataproxy]
timeout = 300
keep_alive_seconds = 300
logging = true

grafana-timeout

What you expected to happen:

Expect that queries should not appear to time out in less time than has been configured in the dataproxy.timeout and dataproxy.keep_alive_seconds setting.

How to reproduce it (as minimally and precisely as possible):

Anything else we need to know?:

Environment:

  • Grafana version: v7.4.2
  • Data source type & version: prometheus
  • OS Grafana is installed on: kubernetes
  • User OS & Browser: macOS & chrome
  • Grafana plugins:
  • Others:
@marefr
Copy link
Member

marefr commented Jun 10, 2021

Duplicate of #34177

@marefr marefr marked this as a duplicate of #34177 Jun 10, 2021
@marefr
Copy link
Member

marefr commented Jun 10, 2021

Fixed and included in Grafana v8.0.0.

@morvencao
Copy link
Author

morvencao commented Jun 11, 2021

@marefr
I gave it a try with latest grafana(grafana/grafana:master) image, but still have the issue, although I updated the timeout dialTimeout and keep_alive_seconds in grafana configuration to 120 seconds:

$ kc get secret grafana-config -o jsonpath="{.data.grafana\.ini}" | base64 -d | grep -A 10 dataproxy
[dataproxy]
timeout = 120
dialTimeout = 120
keep_alive_seconds = 120
logging = true
[log]
level = debug

The request to datasource will still be canceled in 30 seconds from debug logs:

grafana-timeout-latest

/cc @dsotirakis

Am I missing something?

@dsotirakis
Copy link
Contributor

Hello @morvencao, I tried to reproduce on both main and v8 and couldn't replicate your issue - seems to be working fine for me, by only setting timeout (which I guess it's what you are seeking for in this case).

Are you sure that you are tweaking the right configs and/or fields? Do you tweak them inside defaults.ini?

@morvencao
Copy link
Author

morvencao commented Jun 11, 2021

I then updated the configuration to only set timeout to 120:

$ kc get secret grafana-config -o jsonpath="{.data.grafana\.ini}" | base64 -d | grep -C 5 dataproxy
http_port = 3001
root_url = %(protocol)s://%(domain)s/grafana/
domain = localhost
[users]
viewers_can_edit = true
[dataproxy]
timeout = 120

but still getting the "Gateway timeout!" after 30 seconds.

Do you tweak them inside defaults.ini?

I created my own configuration in file called grafana.ini, I can confirm grafana is using my updated grafana.ini?
For dataproxy part, I only add timeout to 120

@marefr marefr added needs more info Issue needs more information, like query results, dashboard or panel json, grafana version etc and removed type/duplicate labels Jun 14, 2021
@marefr
Copy link
Member

marefr commented Jun 14, 2021

@morvencao to me it looks like your Prometheus times out after ~30 seconds. Have you tried to configure query timeout
image

If that doesn't make any difference it could also be limitations in your network stack.

@morvencao
Copy link
Author

morvencao commented Jun 16, 2021

@marefr Yes, I did set the queryTimeout to 60 seconds in datasource configuration, it's still getting the same error after about 30 seconds:

$ kc get secret/grafana-datasources -o jsonpath="{.data.datasources\.yaml}" | base64 -d | grep queryTime
  queryTimeout: 60s

Also I still found the http: proxy error: context canceled error in the proxy logs, looks like it's still the reverse proxy transport issue, it can just cancel the request after 30 seconds.

t=2021-06-16T06:07:36+0000 lvl=eror msg="Data proxy error" logger=data-proxy-log userId=2 orgId=1 uname=kube:admin path=/api/datasources/proxy/1/api/v1/query_range remote_addr=xxx.xxx.xxx.xxx.xxx referer="https://xxx.com/grafana/explore?orgId=1&left=%5B%22now-1h%22,%22now%22,%22Observatorium%22,%7B%22exemplar%22:true,%22expr%22:%22count(count%20by(cluster)%20(coredns_dns_response_rcode_count_total))%22%7D%5D" error="http: proxy error: context canceled"

@marefr
Copy link
Member

marefr commented Jun 16, 2021

@morvencao please try with Grafana v8.0.2. If still the same problem I would believe something in your network stack is closing the TCP connection after 30 seconds. You probably want to use something like wireguard to investigate this further.

@morvencao
Copy link
Author

morvencao commented Jun 16, 2021

thanks @marefr
I just tried with Grafana v8.0.2, still the same retult.
At the same time, I can curl the backend data source in the grafana pod without timeout:

# kc exec -it observability-grafana-7bf869854d-gjdt7 -- bash
curl -s -o /dev/null -w "{\nhttp_code: %{http_code},\ntime_total: %{time_total}\n}\n" -d "query=count%28count+by%28cluster%29+%28node_cpu_seconds_total%29%29&time=1623860151&timeout=60s" http://observability-thanos-query-frontend.observability.svc.cluster.local:9090/api/v1/query_range
{
http_code: 200,
time_total: 36.592677
}

I'll try to debug my network with your suggest tool, thank you again.

@Raboo
Copy link

Raboo commented Feb 8, 2023

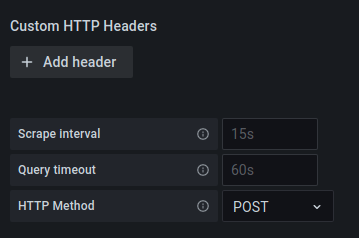
@morvencao The datasources configuration page usually has a timeout field that when left blank defaults to 30s. You can try to modify the timeout there.

@ibarryyan
Copy link

I know

Sign up for free to join this conversation on GitHub. Already have an account? Sign in to comment
Labels
needs more info Issue needs more information, like query results, dashboard or panel json, grafana version etc
Projects
None yet
Development

No branches or pull requests

5 participants