Machine Learning (CS4641) - Georgia Institute of Technology Project consist of 5 collaborative students
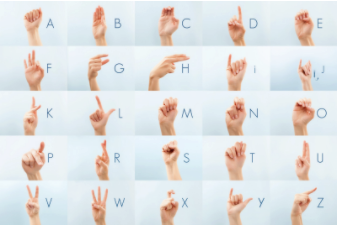
With all the technological advancements today, we see the language barriers between people of all backgrounds being continuously diminished. However, we want to specifically dedicate this project to contribute to the improvement of the means of communication of the American Deaf community as approximetly 10 Million people are hard of hearing and close to 1 Million people are functionally deaf. The American Sign Language (ASL) is a language expressed by the hands and face. This language is used to communicate with and between hearing impaired individuals.With our project, we aim to build a model that is able to successfully classify images/still sign language into English letters using supervised learning algorithms. We will also use Unsupervised learning for feature reduction. Also, it’s worthy to note that we will be classifying only 24 out of the 26 letters in the alphabet as letters z and j involve movements. We will be using the MNIST ASL dataset that contains 34627 images of signs and their corresponding labels.
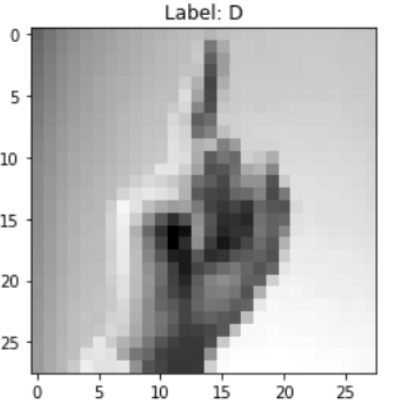
As mentioned above, we will be using the MNIST ASL dataset for our project. The dataset is split into 80% training data and 20% testing data. The data is provided in the form of a CSV file with approximately 34,000 rows corresponding to every image/data point, as well as 785 columns, where the first column is the label of the image and takes values from 0-24 corresponding to the letters in the alphabet A-X (as mentioned, the letters Z and J involve movement in ASL and are therefore omitted from our project, this means there will be no labels 9 or 25) . The rest of the 784 columns are the values of every pixel from 1 to 784 in a 28x28 image, and since all images will be black and white, the values of these cells range from 0 to 255. After reading and processing the data into a panda’s data frame, we found out that there was no missing data and there were no values that were out of the ordinary (no pixel value was out of the range 0-255, and no label value was out of the range 0-24 excluding 9). As an example, this is the output for a randomly chosen image from the training dataset.
Since the pictures are 28x28 pixels, the total number of features per picture is 784. This would make it much harder (more computationally exhausting) to train the supervised learning algorithms. Therefore, we decided to apply PCA to reduce the number of features without significantly impacting the performance of the model. PCA uses the eigenvectors of the covariance matrix of the data to transform the data matrix to another subspace where some features are more meaningful than others and we can use a subset of principal components to represent the all the features We will be testing the modified dataset for several algorithms in this project, specifically we will try to use it in the SVM, Logistic regression, and Random forest algorithms.
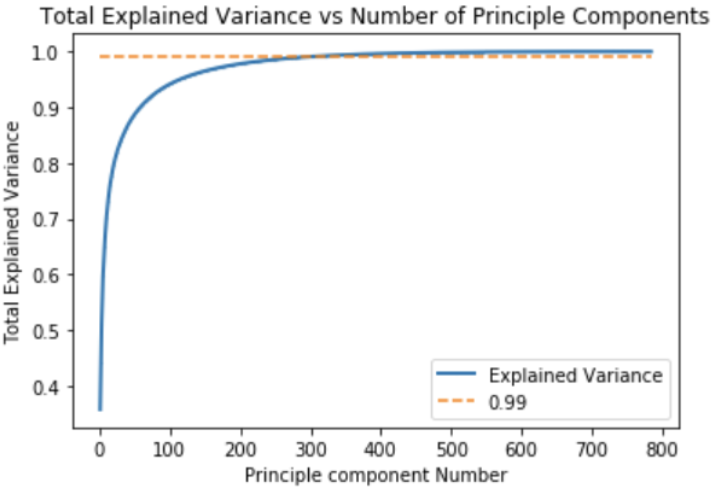
From the PCA model, we discovered that the first 150 principal components capture more than 96% of the total variance in the model. This can also be supported by the figure above where we see that the cumulative explained variance by the first 150 principal exponents exceeds the line 0.96. In some of the following algorithms we will be testing these 150 principle components and see if they can replace the original features.
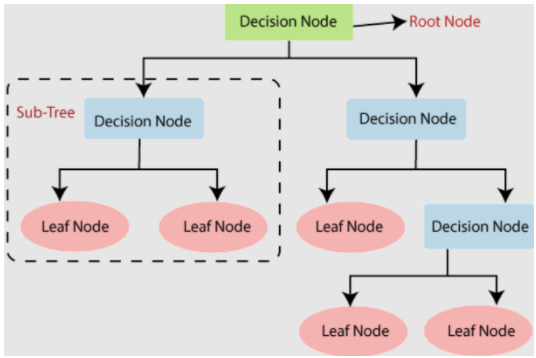
Decision Trees are a family of classifiers that interprets each feature separately and splits the data based on its values. In our case the decision tree will split the data based on our features (pixels) as a value of their intensity. In other words, the tree will start at one pixel and split the data into 2 branches the first if the intensity is high and the other if the intensity is low. It will recursively repeat this process until we get to the leaves (final label) or we decide to stop at a certain depth to avoid overfitting.
Our optimal decision tree obtained an accuracy of 0.6. However, instead of figuring out ways to improve this model, we decided to invest more time on random forests.
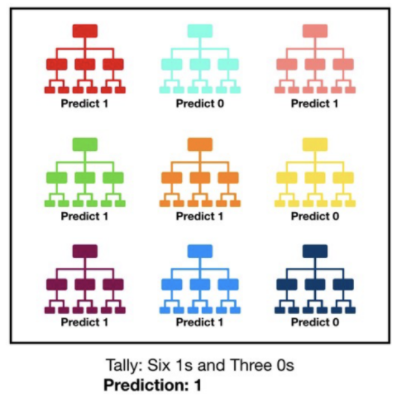
One way to improve the accuracy of classifiers is to use ensemble learning. In this case we will use bagging, where multiple decision trees will be trained, and the output will be a combination of the results from the decision trees. Also, instead of manually training multiple decision trees, we will be using the Random Forest algorithm which not only trains multiple decision trees, but also introduces an extra element of randomness by training each tree on a specific subset of features.
Moreover, there are multiple hyperparameters when it comes to Random Forests. The ones that we will focus on and use 3-Fold Cross Validation to optimize are:
- Number of Decision Trees
- Maximum Depth of each decision Tree
- Minimum number of samples required to split a node
- Maximum Number of features to consider when splitting
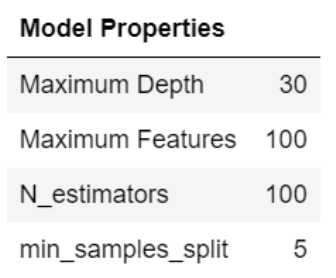
We tested the model with both the original dataset and the PCA modified dataset. Even though we predicted that the PCA modified dataset would give better results, it turns out that on our dataset the original features perform better. The best performing model (trained on the original dataset) had the following final results.
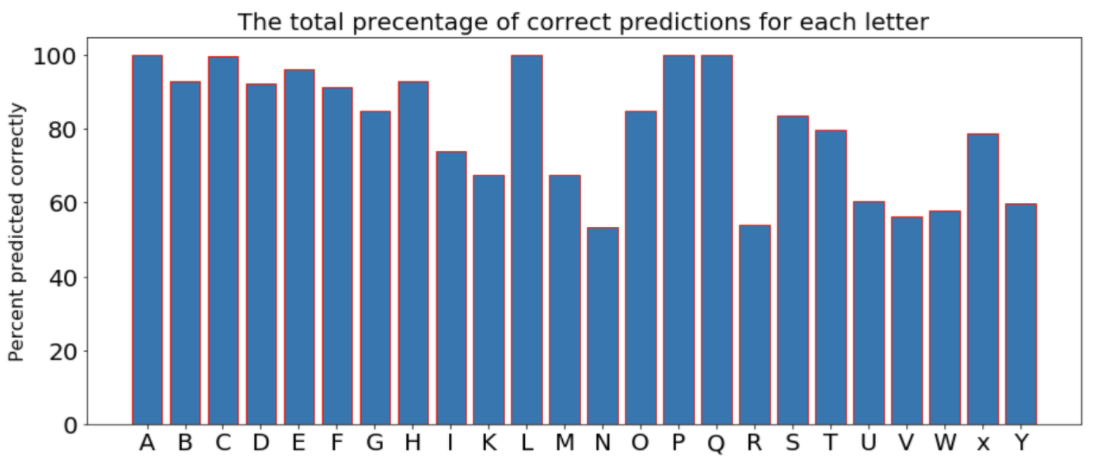
As we can see from the plot, the performance of the model varies significantly from letter to letter. the model performs best with the letter A at almost 100% accuracy, but performs the worst for the letter "N" with around 52% accuracy.
The overall accuracy for the model (for all letters combined) is around 82%.
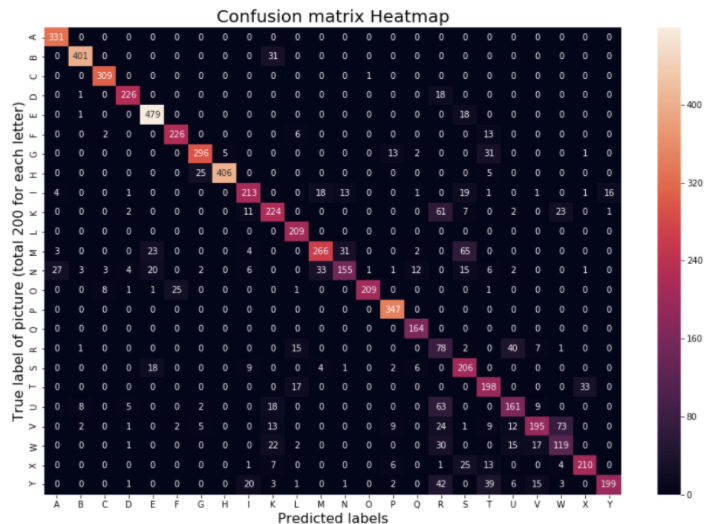
After closely inspecting the reasons why the original dataset performed much better than the PCA modified one, and why some of the letters are getting misclassified for others even though from the pictures we cannot see clear similarities between them. We believe that due to the nature of decision trees and random forests and how they work, they are unable to capture spatial connections well, this could explain why PCA didn’t really work well, and why we were unable to understand why different letters that don’t really look similar are being classified the same. On the other hand, our model still had an overall prediction accuracy of approximately 0.82.
Logistic Regression is a statistical method that can be used to classify data into classes. It is typically used on binary data, but can be performed with multiple classes as well, such as in our problem of classifying American Sign Language letters.
In simple logistic regression, there are two possible classes and linear regression is performed on the data from those classes using the following formula to get a linear combination of weights and features:
s=x=0+1x1+...+ixi
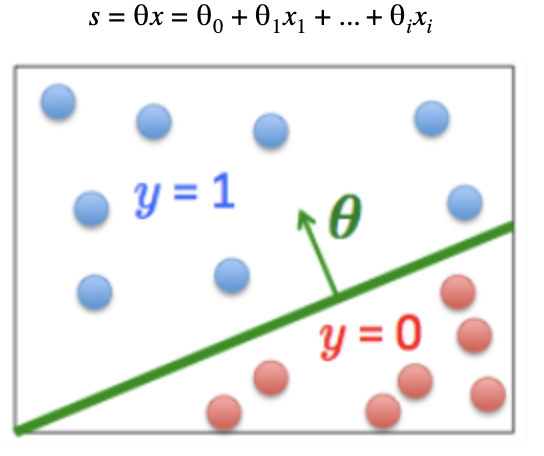
Once an equation is found from linear regression, that can then be plugged into the logistic regression equation to create a non-linear sigmoid function that will give the probability of each point from 0 to 1. To decide the class of each point, a threshold is set on the probability, typically 0.5.
In multiclass logistic regression, a technique called one one-vs-rest is used. For each class, logistic regression is performed on that individual class versus all other classes combined. To decide the classification of new inputs into the multiclass model, the classification that results in the highest probability generated for that respective logistic regression is selected.
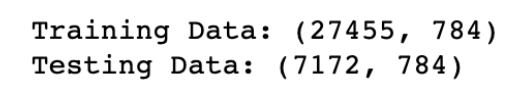
Using the sklearn package in Python, we easily formulated a multiclass linear regression model that uses the images of American Sign Language letters to classify which letter is being symbolized by the hand. We started by importing all the necessary modules and splitting the data into training and testing sets. An 80/20 percent split was used and resulted with the following number of instances with 784 pixels (28 x 28).
Next, we created and fit the logistic regression model using the training data and the sklearn.linear_model.LogisticRegression() function. Then, we tested our model by inputting the testing data into our model and compared it to the actual labels of the test data. We also built another model where we inputted the PCA modified dataset to see how its results would compare.
We observed that the model trained with the original dataset performed with an accuracy of about 67%. However, the one trained with the PCA dataset scored slightly lower. Therefore, we decided to stick with the first model for this algorithm. Below are the detailed results for the chosen model’s performance.
Next, we used grid search cross-validation to tune the model’s hyperparameters. This was done on both the PCA and non-PCA dataset. The highest accuracy obtained was 68% using C=0.046415888336127774. Again, the regular dataset slightly outperformed the PCA dataset, however using the PCA dataset for cross-validation saves a lot of time.
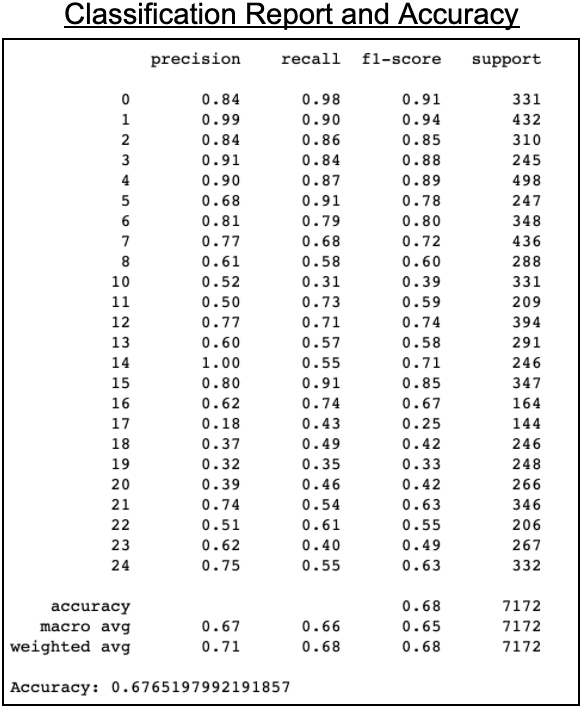
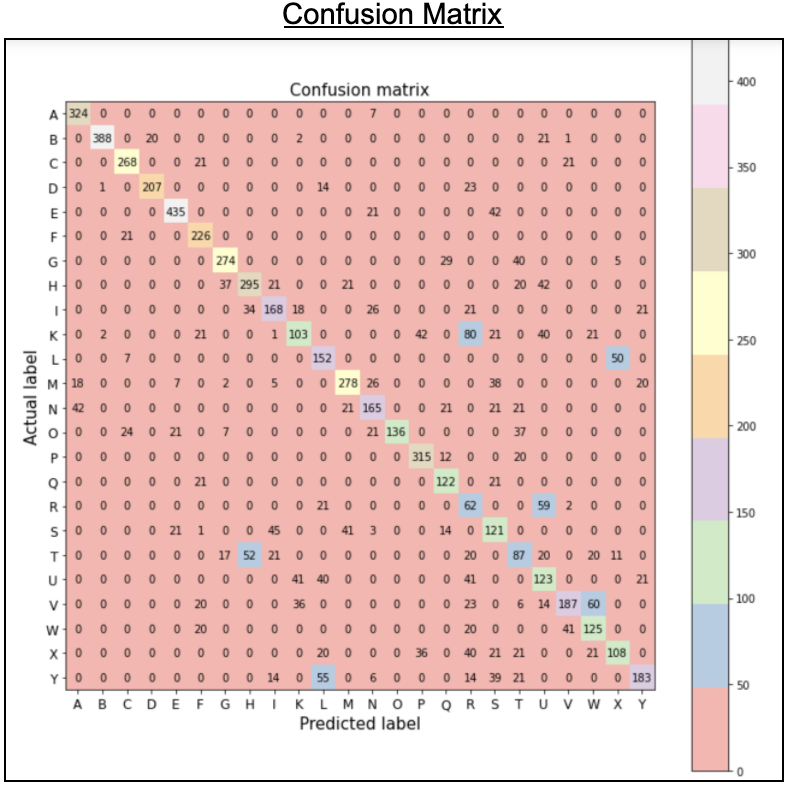
Using the above classification report and confusion matrix we can see which hand symbols were most accurately predicted correctly versus the ones that had the most issues. Letters A, B, E, F, and P performed particularly well while letters I, K, O, R, S, T, U, V, X performed particularly poorly.
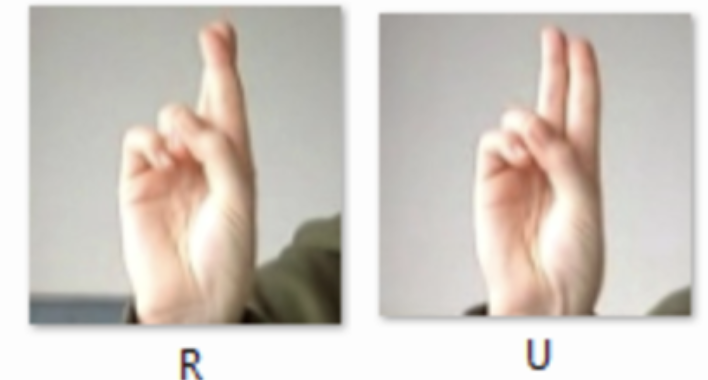
Overall, our multiclass logistic regression performed pretty well in classifying which letter is being symbolized in an image of a hand performing sign language. However, logistic regression appears to not be the best method to use to classify such images because we can see that it resulted in many letters being confused for other letters even though we attempted multiple hyperparameters and applied cross validation. Such examples of this occurring can be seen with letters V and W, R and U, T and H, and Y and L. This makes sense because when comparing the hand signals for these pairs of letters, they are quite similar. This makes it hard for logistic regression to perform with high accuracy because the pixels of images of these symbols which are similar will be hard to distinguish which letter is actually being symbolized.
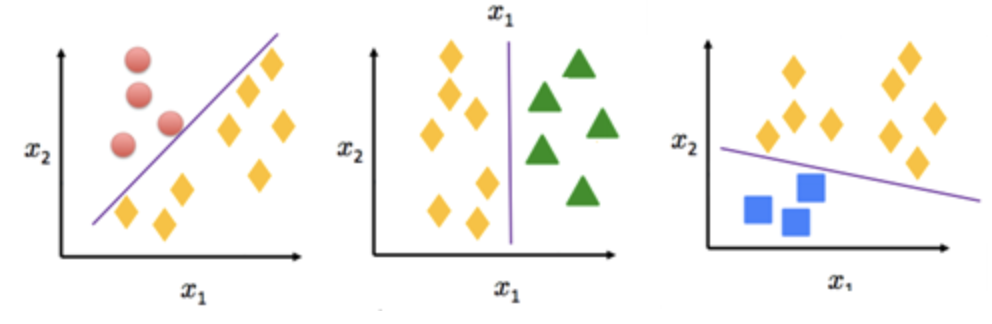
A support-vector machine is a supervised learning model that does binary classification on inputs. Multi-class classification is needed for determining American Sign Language letters. Thus, we can convert the multi class case into multiple binary classifications quite easily.
SVM aims to divide the data in a way such that the gap between the 2 classes of data points is the largest. This can be visualized below.
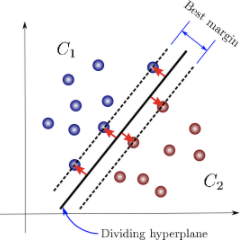
Using the SKLearn package in python, we can perform SVM quite easily. To begin, we loaded in the separate CSVs of testing and training data. We trained 2 separate models, one on the original dataset and another on the PCA modified dataset, which reduced the images to their principal components, as we talked about more in the data section.
Next, we fit the models to the training data using SKLearns fit method. From here, we ran the test data through the models and received our predictions.
We found out that the model trained with the PCA modified dataset performs better as it achieves an accuracy of approximately 78.2% compared to the other models 76% accuracy. Not to mention that the PCA model had a much less computation time. Below are the results for the model trained with the PCA dataset.
We can see the precision of the model is about 79%. There are some letters that perform poorly while some have accuracies as high as 100%. B, D, E are exceptionally well recognized by our model while X, R, U perform badly. The bad performance in recognizing R and U can be attributed to the similar looking signs as shown in the Logistic regression section. Overall, SVM performs very well in identifying signs.
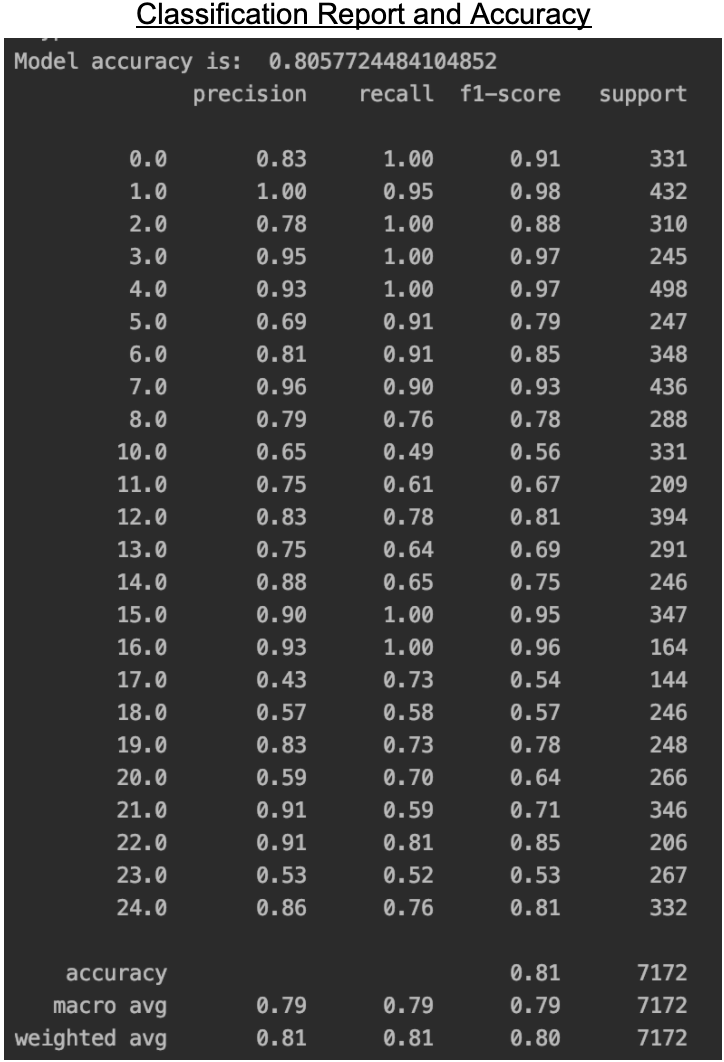
Next, we applied cross validation hyperparameter tuning to see if we could further increase the accuracy of our model.The main parameter that we optimized was C, the tradeoff between Maximizing the margin and correct classification. Switching from a c=1 to a c=0.5 we can see a 5% increase in the accuracy of our model. Further, using cross validation ensures that we do not overfit our model while testing for hyper parameters. Below is a classification report along with our model accuracy.
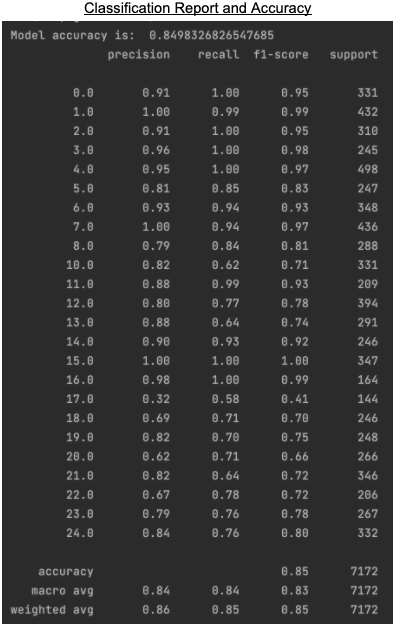
We can see the precision of the model is about 85%. There are some letters that perform poorly while some have accuracies as high as 100%. B, D, E are exceptionally well recognized by our model while X, R, U perform badly. The bad performance in recognizing R and U can be attributed to the similar looking signs as shown in the Logistic regression section. Overall, SVM performs very well in identifying signs.
Convolutional neural networks are made up of multiple layers of artificial neurons. Each neuron represents mathematical functions that calculate the weighted sum of multiple inputs and applies an activation value to produce an output. CNN’s are renowned to be one of the best algorithms for image classification. Thus our project takes advantage of this model to attempt to translate sign language images into text.
CNN’s are able to reduce the number of features on their own as they use shared parameters and compared to fully connected Neural networks and other supervised learning algorithms, CNN’s are very good at dealing with overfitting, therefore we believe that using the PCA modified dataset would be unnecessary.
The model begins by converting the data into numpy arrays. It proceeds to create a dataset for training, which contains 80% of the data, and a dataset for testing which contains the remaining 20% of the data. The data is then normalized and the labels are reshaped. A constant bias neuron is then introduced.
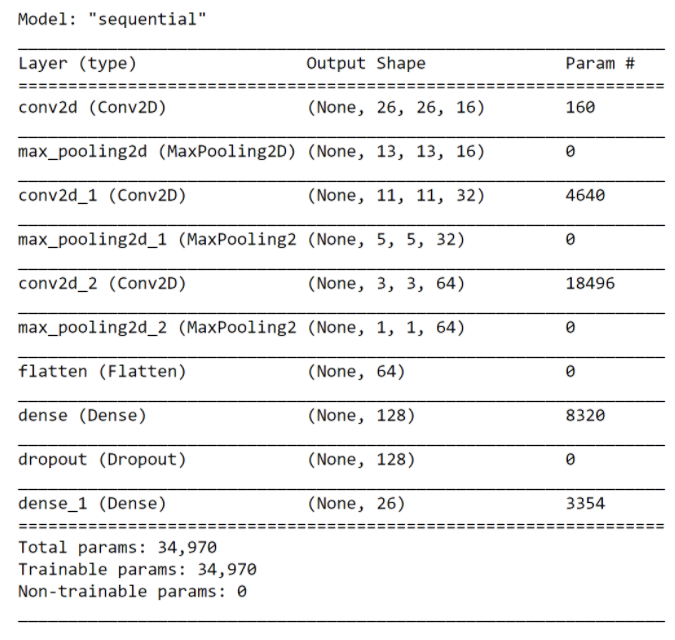
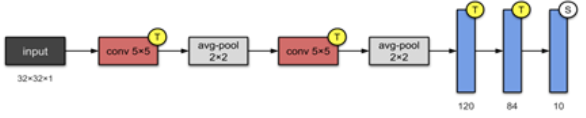
To build the CNN, we used multiple couples of convolution followed by max pooling layers. In each Convolution layer, several filters/kernels are applied to capture certain patterns in the data. Also the max pooling layers summarize the convoluted feature matrices by taking the maximum value of each 2x2 block as a representative of the sharpest feature. Finally, we flattened out the feature matrix and then passed it through a fully connected network for classification. Below is the full model architecture.
The model is then compiled with “adam” as the optimizer, accuracy as the main metric, and the main loss function being categorical cross entropy loss. After that it is trained based on the hyperparameters of batch size, number of classes, and number of propagations. The number of classes is determined by the amount of letters we wish to identify. The model runs through forward passes and back propagation as it is trained (and updates the parameters using gradient descent).
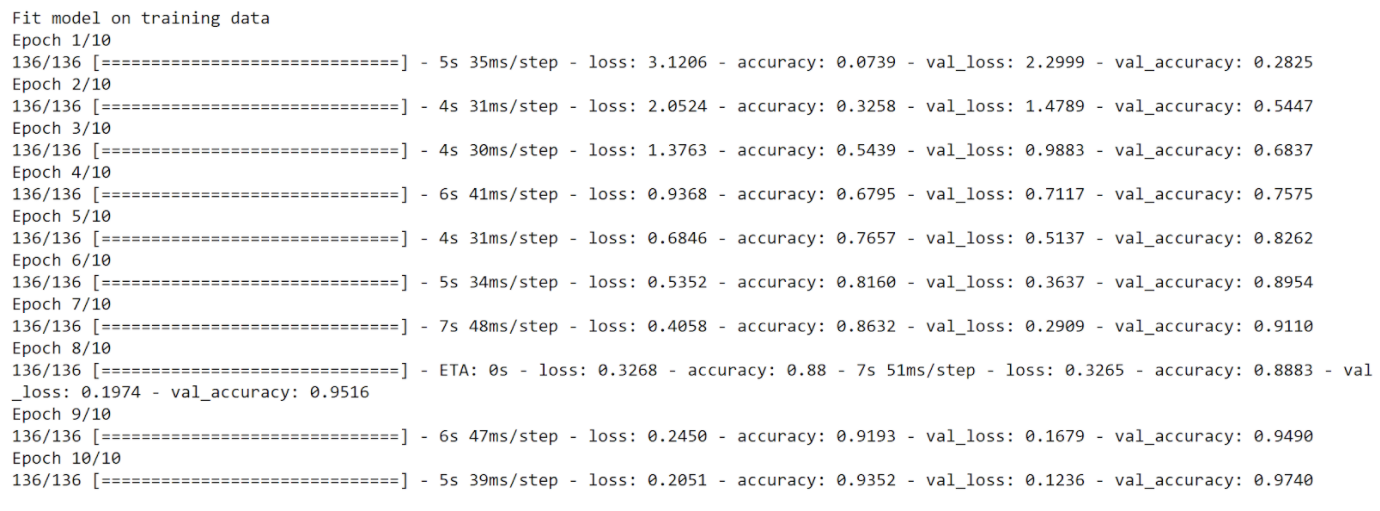
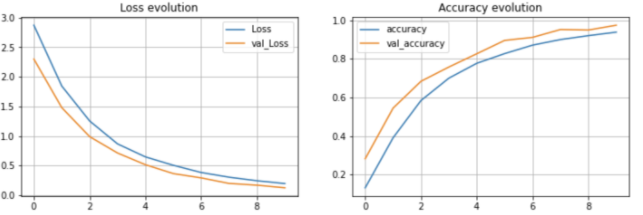
As we can see from the plots above, the model showed quick growth as the number of epochs increased and was able to achieve a near perfect accuracy towards the end. It finished with a 97% accuracy.
Even though we have achieved very good results with our current architecture, we wanted to explore how other architectures would perform. Specifically we have implemented the LeNet architecture shown in the figure below.
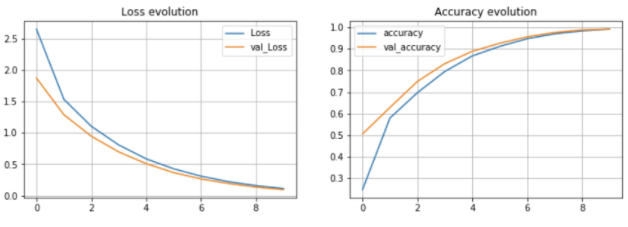
As we can see from the plots above, the model showed quick growth as the number of epochs increased and was able to achieve a near perfect accuracy towards the end. It finished with a 99% accuracy.
Overall, both architectures performed really well, however we observed that the LeNet architecture achieved a slightly higher accuracy and therefore it will be the one we will be considering for our final CNN model
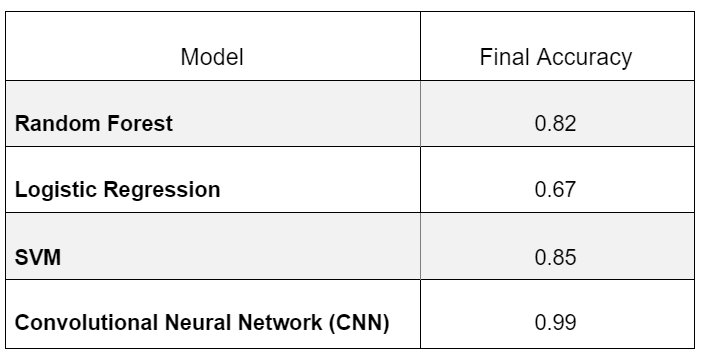
As we can see, CNN performs best, followed by Random forest, then SVM and finally logistic regression.
Overall, CNN currently achieves an accuracy of 0.99 which is really good for the purpose of our project. However, these are possible extensions to our project.
- Attempting to use other non-linear methods of Dimensionality reduction as PCA proved to be ineffective for the most part
- Incorporating the letters “j” and “z” (by inputting the final or initial gesture of the letter to represent them) into the project and seeing how our models would perform
- Expanding the project to a larger dataset with clearer and higher quality images (Ex: size 64x64) and seeing how our current algorithms perform.
- Developing an RNN or a CNN that can handle video data and is able to classify sequences of images not only into letters but also into words and sentences.
We feel like the possibilities of such a project are endless, one example of just how easily we can incorporate this idea into our everyday life is an application that allows for smooth interactions between and with hearing impaired people.
[1] Julichitai. (2021, February 19). ASL alphabet classification using PyTorch. Retrieved February 28, 2021, from https://www.kaggle.com/julichitai/asl-alphabet-classification-using-pytorch
[2] Tecperson. (2017, October 20). Sign language mnist. Retrieved March 01, 2021, from https://www.kaggle.com/datamunge/sign-language-mnist
[3] Sign language recognition using python and opencv. (2020, September 15). Retrieved March 01, 2021, from https://data-flair.training/blogs/sign-language-recognition-python-ml-opencv/
• Bahjat Abugharbieh: Data Processing, Discussion, Random Forests
• Hasan Naseer: CNN, Website formation
• Wilson White: Introduction, Logistic Regression
• Luke Lascala: Introduction, SVM
• Mohammed Abdulbari: CNN