Expected behaviour
It appears if you have a floating colorAxis legend for a map chart, the legend just truncates rather than re-adjusting to fit the given width. I would expect the legend/axis to size within the given width.
Actual behaviour
https://jsfiddle.net/rd3607s5/
You can see in this fiddle that the the last label is not at the edge of the axis/legend. Upon some element inspection, it appears that the full legend width is still drawn instead of actually sizing to the approropriate given width, so it appears cut off.
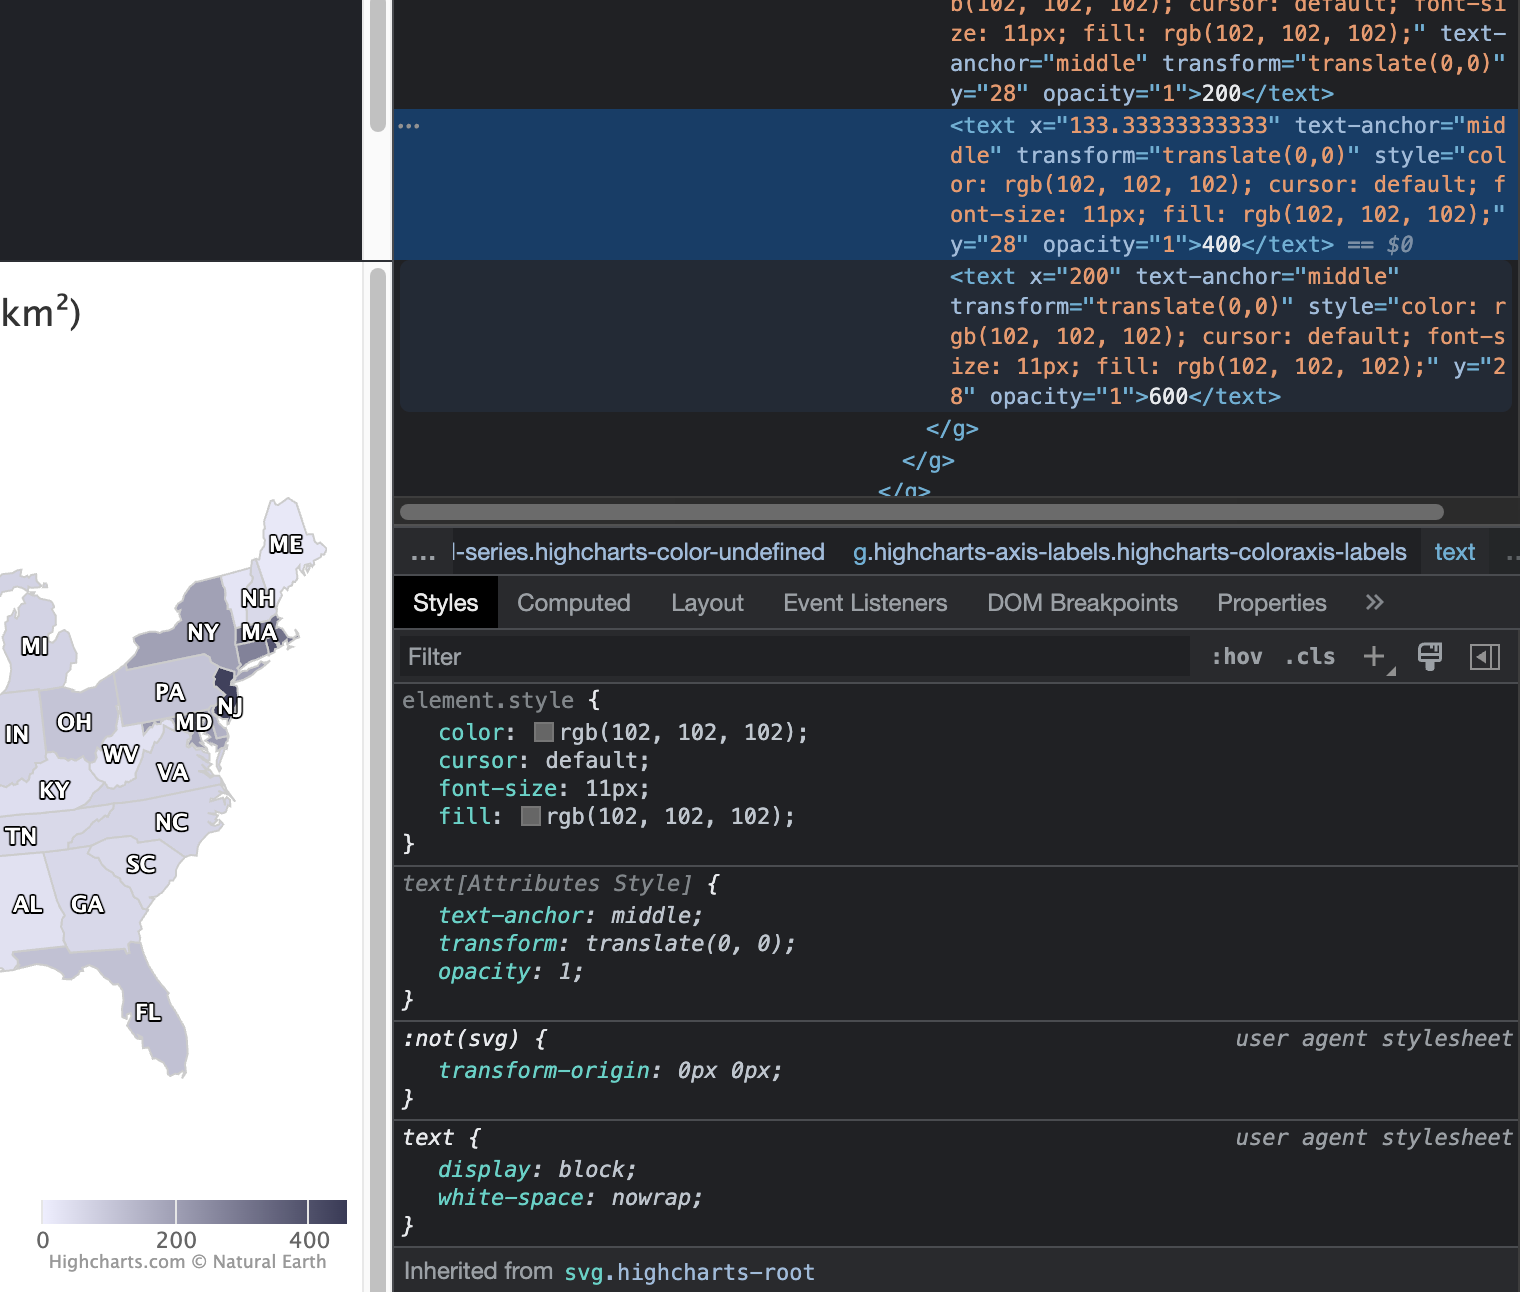
Some additional context: I have map charts that will be displayed within different sizes of containers. Because there isn't a maxWidth option for legends (which I also wish was added), I have to do something like this:
  let legendWidth = chartWidth / 3;
  if (legendWidth > 200) legendWidth = 200;
  if (legendWidth < 130) legendWidth = 130;
This issue happens with both pixel and percentage values. (tested with the above block adding this line: legendWidth = `${(legendWidth / chartWidth) * 100}%`;)
Product version
highcharts 10.2.1 with maps module
Affected browser(s)
any, mostly tested in chrome latest

Expected behaviour
It appears if you have a floating colorAxis legend for a map chart, the legend just truncates rather than re-adjusting to fit the given width. I would expect the legend/axis to size within the given width.
Actual behaviour
https://jsfiddle.net/rd3607s5/
You can see in this fiddle that the the last label is not at the edge of the axis/legend. Upon some element inspection, it appears that the full legend width is still drawn instead of actually sizing to the approropriate given width, so it appears cut off.

Some additional context: I have map charts that will be displayed within different sizes of containers. Because there isn't a maxWidth option for legends (which I also wish was added), I have to do something like this:
This issue happens with both pixel and percentage values. (tested with the above block adding this line:
legendWidth = `${(legendWidth / chartWidth) * 100}%`;)Product version
highcharts 10.2.1 with maps module
Affected browser(s)
any, mostly tested in chrome latest