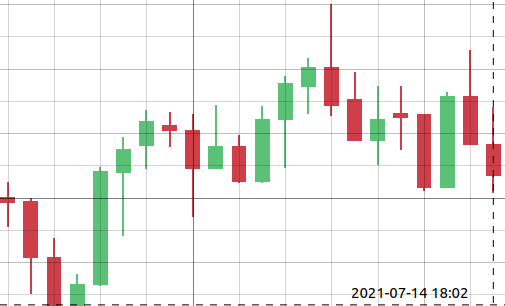
I have noticed that grid lines are drawn above the candlesticks like this:
In order to send the grid lines to back, I set the Z value to -1000 here:
|
ax.axes['left']['item'].setZValue(30) # put axis in front instead of behind data |
and here too:
|
ax.axes['bottom']['item'].setZValue(30) |
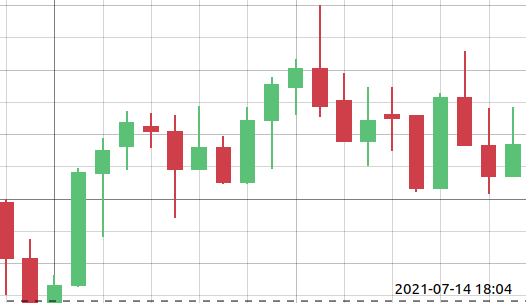
Now the grid lines appear behind the candlesticks like this:
But as you can see here:
|
ax.axes['left']['item'].setZValue(30) # put axis in front instead of behind data |
there is this note:
put axis in front instead of behind data
I wonder what, if any, problems I might face if I set the Z value to -1000 to send the grid lines behind the candlesticks? Or is there any other recommended way to draw the grid lines behind the candlesticks?
I have noticed that grid lines are drawn above the candlesticks like this:
In order to send the grid lines to back, I set the Z value to -1000 here:
finplot/finplot/__init__.py
Line 1847 in 1190e8a
and here too:
finplot/finplot/__init__.py
Line 1848 in 1190e8a
Now the grid lines appear behind the candlesticks like this:
But as you can see here:
finplot/finplot/__init__.py
Line 1847 in 1190e8a
there is this note:
put axis in front instead of behind data
I wonder what, if any, problems I might face if I set the Z value to -1000 to send the grid lines behind the candlesticks? Or is there any other recommended way to draw the grid lines behind the candlesticks?