


Folium builds on the data wrangling strengths of the Python ecosystem and the mapping strengths of the Leaflet.js library. Manipulate your data in Python, then visualize it in on a Leaflet map via Folium.
Folium makes it easy to visualize data that's been manipulated in Python on an interactive Leaflet map. It enables both the binding of data to a map for choropleth visualizations as well as passing Vincent/Vega visualizations as markers on the map.
The library has a number of built-in tilesets from OpenStreetMap, MapQuest Open, MapQuest Open Aerial, Mapbox, and Stamen, and supports custom tilesets with Mapbox or Cloudmade API keys. Folium supports both GeoJSON and TopoJSON overlays, as well as the binding of data to those overlays to create choropleth maps with color-brewer color schemes.
$ pip install foliumTo create a base map, simply pass your starting coordinates to Folium:
import folium
map_osm = folium.Map(location=[45.5236, -122.6750])
map_osm.create_map(path='osm.html')
Mapbox Bright, and Mapbox Control room tiles are built in:
stamen = folium.Map(location=[45.5236, -122.6750], tiles='Stamen Toner',
                    zoom_start=13)
stamen.create_map(path='stamen_toner.html')
Folium also supports Cloudmade and Mapbox custom tilesets- simply pass your key to the API_key keyword:
custom = folium.Map(location=[45.5236, -122.6750], tiles='Mapbox',
                    API_key='wrobstory.map-12345678')
Lastly, Folium supports passing any Leaflet.js compatible custom tileset:
tileset = r'http://{s}.tiles.yourtiles.com/{z}/{x}/{y}.png'
map = folium.Map(location=[45.372, -121.6972], zoom_start=12,
tiles=tileset, attr='My Data Attribution')style location marker with popup text:
map_1 = folium.Map(location=[45.372, -121.6972], zoom_start=12,
                   tiles='Stamen Terrain')
map_1.simple_marker([45.3288, -121.6625], popup='Mt. Hood Meadows')
map_1.simple_marker([45.3311, -121.7113], popup='Timberline Lodge')
map_1.create_map(path='mthood.html')
Folium supports colors and marker icon types (from bootstrap)
map_1 = folium.Map(location=[45.372, -121.6972], zoom_start=12,tiles='Stamen Terrain')
map_1.simple_marker([45.3288, -121.6625], popup='Mt. Hood Meadows',marker_icon='cloud')
map_1.simple_marker([45.3311, -121.7113], popup='Timberline Lodge',marker_color='green')
map_1.simple_marker([45.3300, -121.6823], popup='Some Other Location',marker_color='red',marker_icon='info-sign')
map_1.create_map(path='iconTest.html')
Folium also supports circle-style markers, with custom size and color:
map_2 = folium.Map(location=[45.5236, -122.6750], tiles='Stamen Toner',
                   zoom_start=13)
map_2.simple_marker(location=[45.5244, -122.6699], popup='The Waterfront')
map_2.circle_marker(location=[45.5215, -122.6261], radius=500,
                    popup='Laurelhurst Park', line_color='#3186cc',
                    fill_color='#3186cc')
map_2.create_map(path='portland.html')
Folium has a convenience function to enable lat/lng popovers:
map_3 = folium.Map(location=[46.1991, -122.1889], tiles='Stamen Terrain',
                   zoom_start=13)
map_3.lat_lng_popover()
map_3.create_map(path='sthelens.html')
Click-for-marker functionality will allow for on-the-fly placement of markers:
map_4 = folium.Map(location=[46.8527, -121.7649], tiles='Stamen Terrain',
                   zoom_start=13)
map_4.simple_marker(location=[46.8354, -121.7325], popup='Camp Muir')
map_4.click_for_marker(popup='Waypoint')
map_4.create_map(path='mtrainier.html')
Folium also supports the Polygon marker set from the Leaflet-DVF:
map_5 = folium.Map(location=[45.5236, -122.6750], zoom_start=13)
map_5.polygon_marker(location=[45.5012, -122.6655], popup='Ross Island Bridge',
                     fill_color='#132b5e', num_sides=3, radius=10)
map_5.polygon_marker(location=[45.5132, -122.6708], popup='Hawthorne Bridge',
                     fill_color='#45647d', num_sides=4, radius=10)
map_5.polygon_marker(location=[45.5275, -122.6692], popup='Steel Bridge',
                     fill_color='#769d96', num_sides=6, radius=10)
map_5.polygon_marker(location=[45.5318, -122.6745], popup='Broadway Bridge',
                     fill_color='#769d96', num_sides=8, radius=10)
map_5.create_map(path='bridges.html')
Folium enables passing vincent visualizations to any marker type, with the visualization as the popover:
buoy_map = folium.Map(location=[46.3014, -123.7390], zoom_start=7,
                      tiles='Stamen Terrain')
buoy_map.polygon_marker(location=[47.3489, -124.708], fill_color='#43d9de',
                        radius=12, popup=(vis1, 'vis1.json'))
buoy_map.polygon_marker(location=[44.639, -124.5339], fill_color='#43d9de',
                        radius=12, popup=(vis2, 'vis2.json'))
buoy_map.polygon_marker(location=[46.216, -124.1280], fill_color='#43d9de',
                        radius=12, popup=(vis3, 'vis3.json'))
buoy_map.create_map(path='NOAA_buoys.html')
Both GeoJSON and TopoJSON layers can be passed to the map as an overlay, and multiple layers can be visualized on the same map:
geo_path = r'data/antarctic_ice_edge.json'
topo_path = r'data/antarctic_ice_shelf_topo.json'

ice_map = folium.Map(location=[-59.1759, -11.6016],
                   tiles='Mapbox Bright', zoom_start=2)
ice_map.geo_json(geo_path=geo_path)
ice_map.geo_json(geo_path=topo_path, topojson='objects.antarctic_ice_shelf')
ice_map.create_map(path='ice_map.html')
Folium allows for the binding of data between Pandas DataFrames/Series and Geo/TopoJSON geometries. Color Brewer sequential color schemes are built-in to the library, and can be passed to quickly visualize different combinations:
import folium
import pandas as pd

state_geo = r'data/us-states.json'
state_unemployment = r'data/US_Unemployment_Oct2012.csv'

state_data = pd.read_csv(state_unemployment)

#Let Folium determine the scale
map = folium.Map(location=[48, -102], zoom_start=3)
map.geo_json(geo_path=state_geo, data=state_data,
             columns=['State', 'Unemployment'],
             key_on='feature.id',
             fill_color='YlGn', fill_opacity=0.7, line_opacity=0.2,
             legend_name='Unemployment Rate (%)')
map.create_map(path='us_states.html')
Folium creates the legend on the upper right based on a D3 threshold scale, and makes the best-guess at values via quantiles. Passing your own threshold values is simple:
map.geo_json(geo_path=state_geo, data=state_data,
             columns=['State', 'Unemployment'],
             threshold_scale=[5, 6, 7, 8, 9, 10],
             key_on='feature.id',
             fill_color='BuPu', fill_opacity=0.7, line_opacity=0.5,
             legend_name='Unemployment Rate (%)',
             reset=True)
map.create_map(path='us_states.html')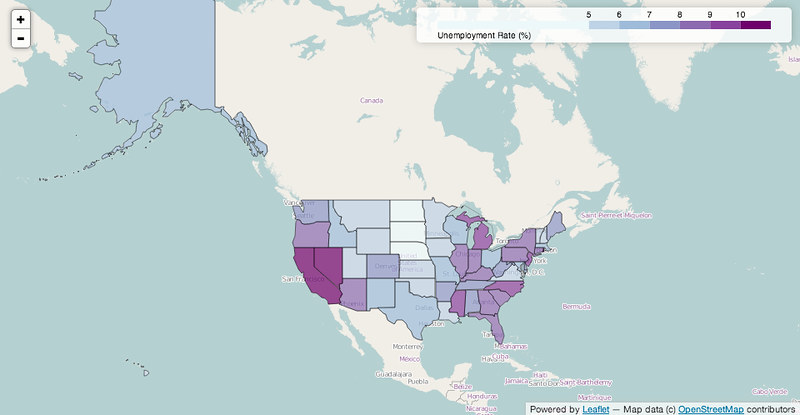
By binding data via the Pandas DataFrame, different datasets can be quickly visualized. In the following example, the df DataFrame contains six columns with different economic data, a few of which we will visualize:
#Number of employed with auto scale
map_1 = folium.Map(location=[48, -102], zoom_start=3)
map_1.geo_json(geo_path=county_geo, data_out='data1.json', data=df,
               columns=['GEO_ID', 'Employed_2011'],
               key_on='feature.id',
               fill_color='YlOrRd', fill_opacity=0.7, line_opacity=0.3,
               topojson='objects.us_counties_20m')
map_1.create_map(path='map_1.html')
#Unemployment with custom defined scale
map_2 = folium.Map(location=[40, -99], zoom_start=4)
map_2.geo_json(geo_path=county_geo, data_out='data2.json', data=df,
               columns=['GEO_ID', 'Unemployment_rate_2011'],
               key_on='feature.id',
               threshold_scale=[0, 5, 7, 9, 11, 13],
               fill_color='YlGnBu', line_opacity=0.3,
               legend_name='Unemployment Rate 2011 (%)',
               topojson='objects.us_counties_20m')
map_2.create_map(path='map_2.html')
#Median Household income
map_3 = folium.Map(location=[40, -99], zoom_start=4)
map_3.geo_json(geo_path=county_geo, data_out='data3.json', data=df,
               columns=['GEO_ID', 'Median_Household_Income_2011'],
               key_on='feature.id',
               fill_color='PuRd', line_opacity=0.3,
               legend_name='Median Household Income 2011 ($)',
               topojson='objects.us_counties_20m')
map_3.create_map(path='map_3.html')
Jinja2
Pandas (Map Data Binding only)
Numpy (Map Data Binding only)
Vincent (Map Data Binding only)
Beta