- install all babel parser versions
npm run install
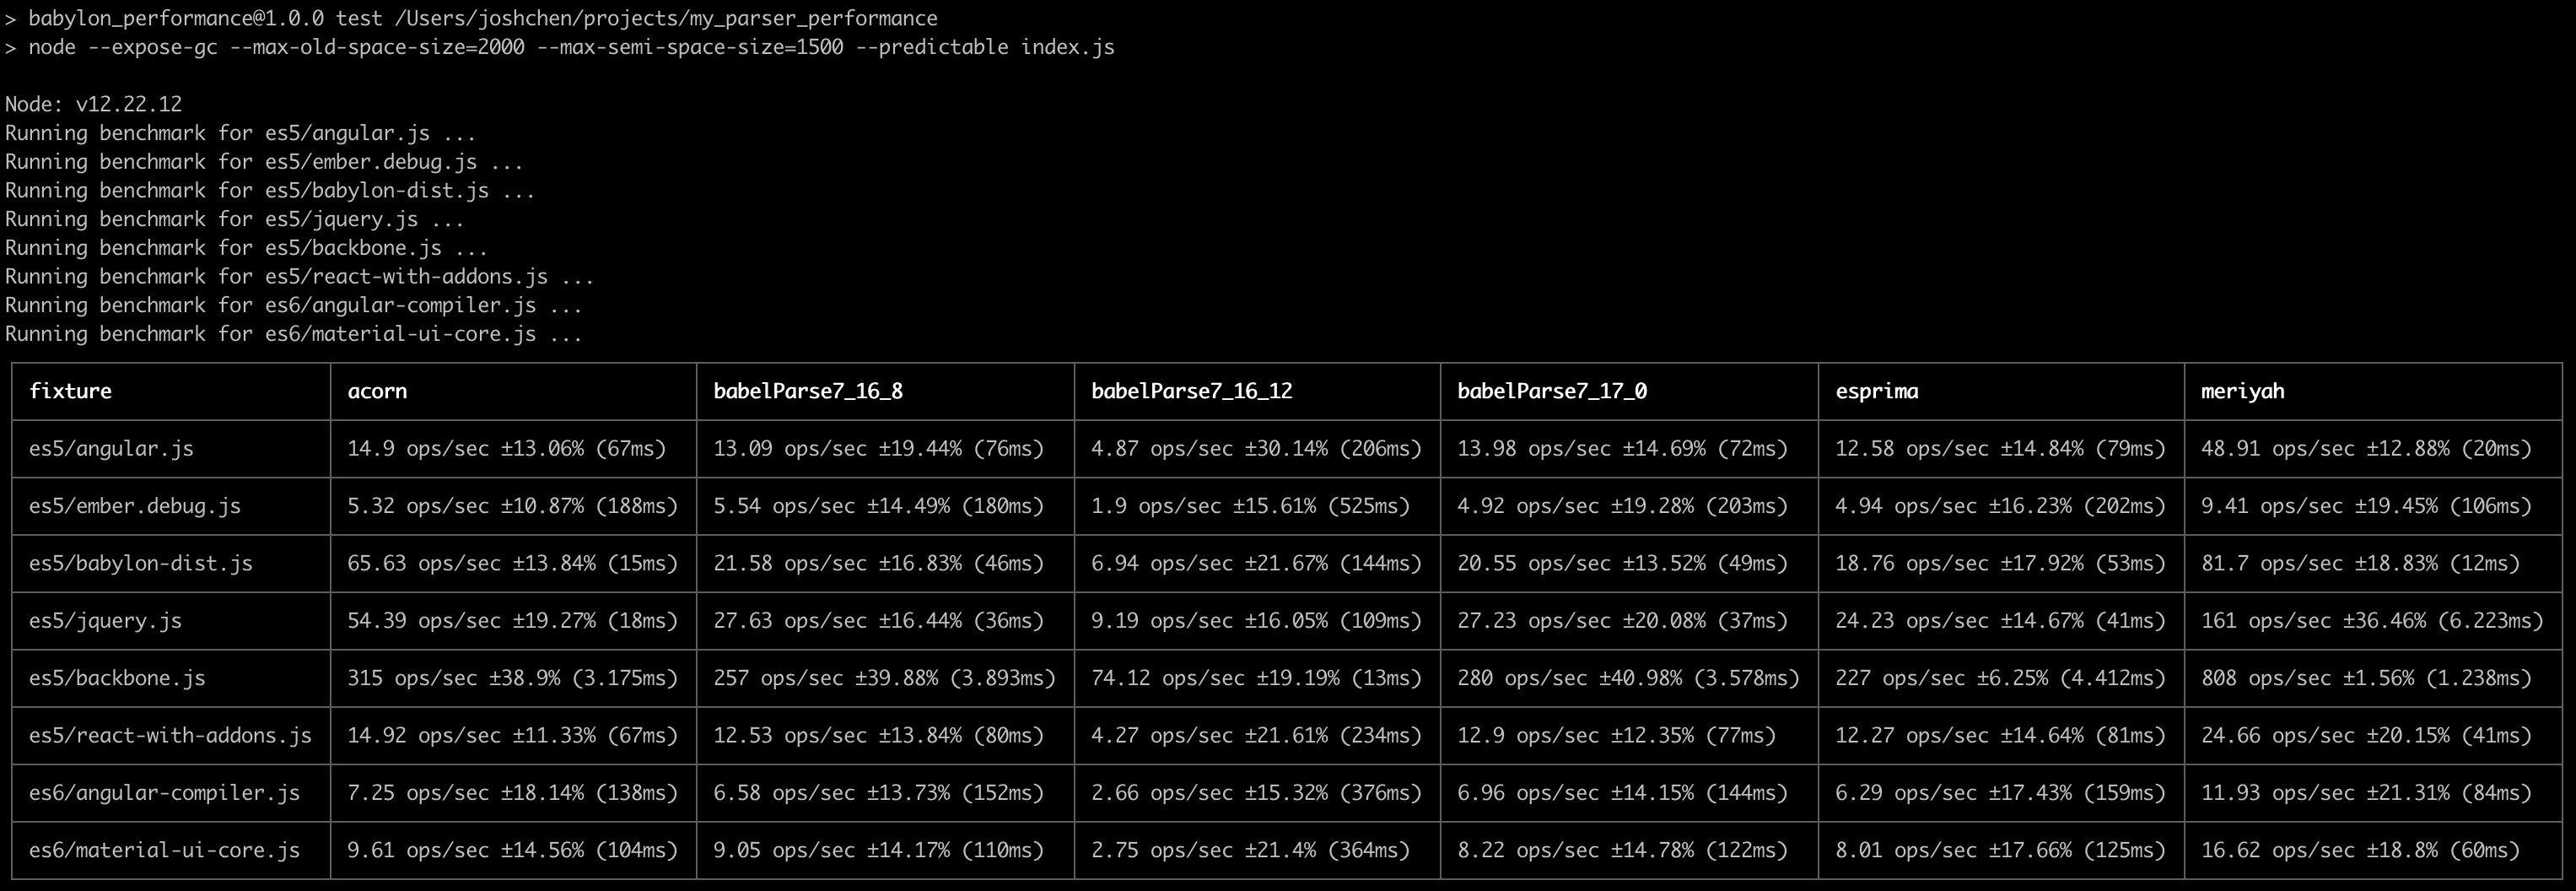
- Run performance tests from parser_performance
BABEL_PARSER=7.16.8,7.16.10,7.17.0 npm run test
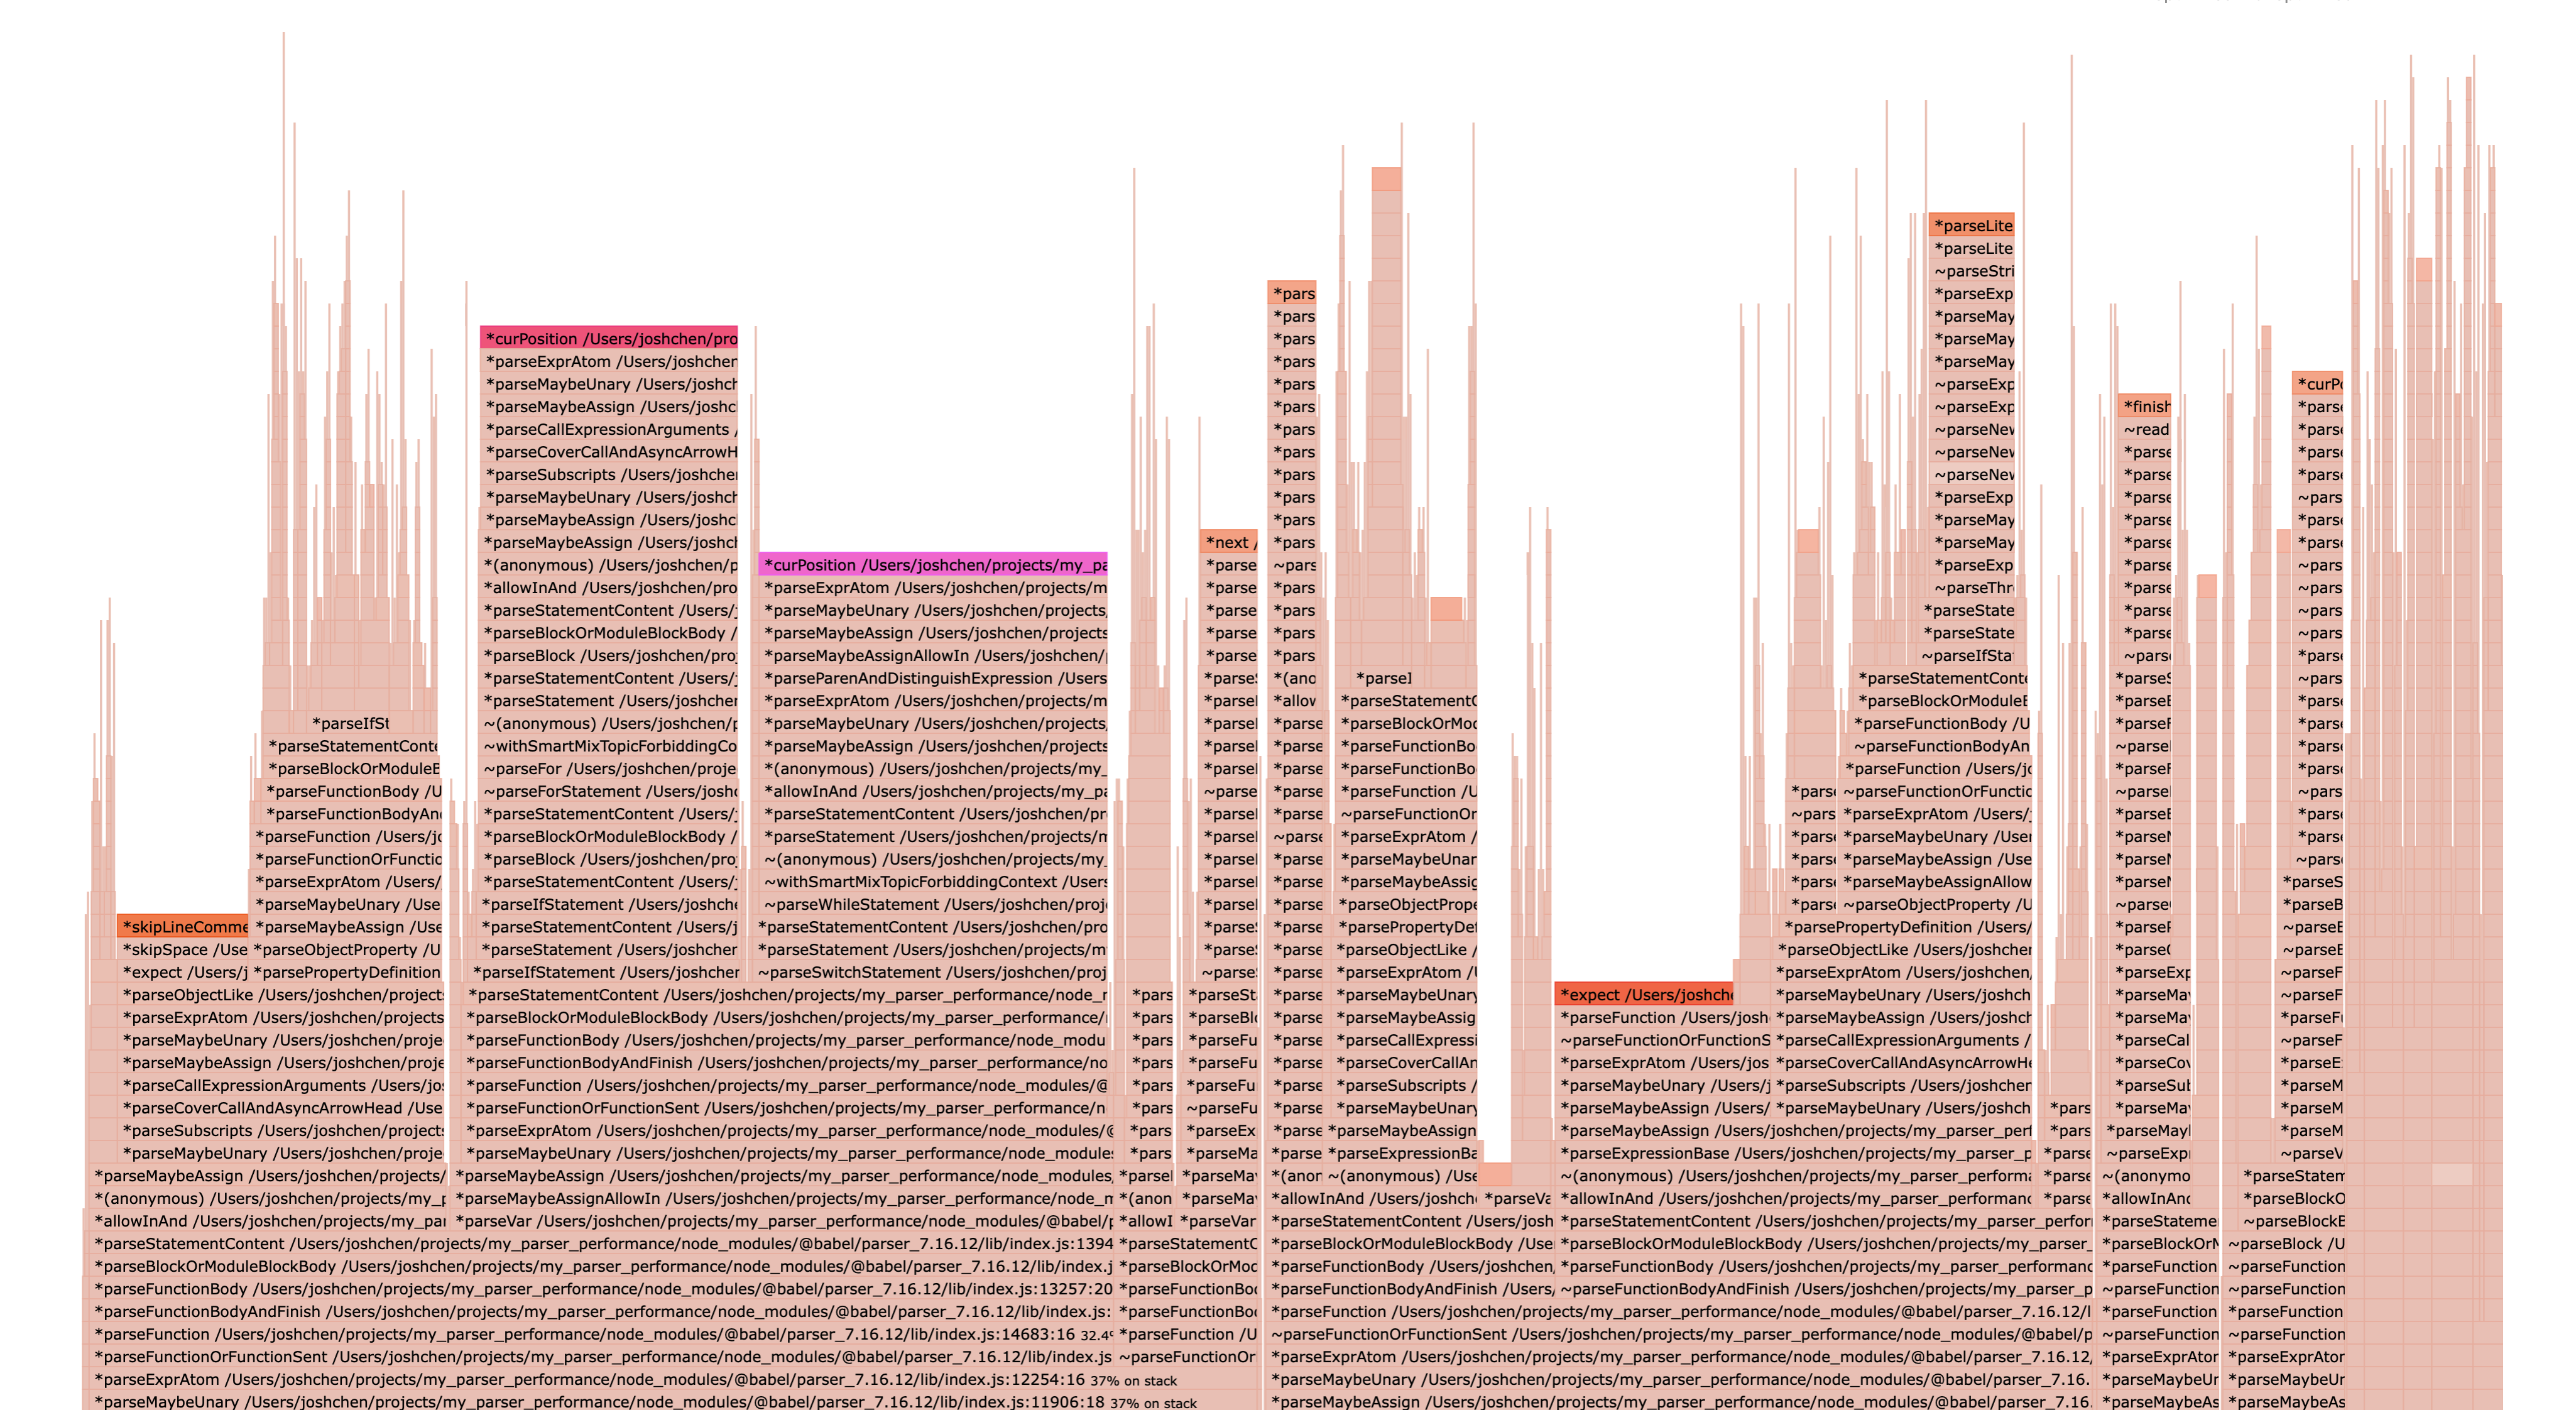
- Get Flamegraph using 0x to look for root cause of slowness
BABEL_PARSER='7.16.10' 0x -o profile.js
Parses various fixtures and outputs parse times over various iterations
cd babel
NODE_ENV=production BABEL_ENV=production gulp build-rollup
It is recommended to clone parser_performance next to babel repository
git clone git@github.com:babel/parser_performance.git
yarn
PARSER_ALL=1 yarn run test // performance test
yarn run memory // memory usage testCheck the performance label in the babel repo for some examples.
# Run performance test with all fixtures on local babel build
yarn run test

# Run performance test on ember.js fixture and compared to baseline babel parser
FILE=ember PARSER=babel,dev yarn run test

# Run performance test on all parsers and all files
PARSER_ALL=1 yarn run test

# Specify a custom babel parser path and run performance test on all files
BABEL_PARSER_PATH=relative/path/from/parser_performance/to/babel-parser yarn run testMicrobenchmarks don't help that much, should test the real thing? (Also I don't know what I'm talking about)
- Caching,
Set.hasvs.[].indexOf(val), hoisting, GC issues - Make sure node shapes are the same (should be automated) babel/notes#9
nvm use 12
node -vIt's a chrome Extension that helps automatically open the devtools when running --inspect
node --prof script.js
node --prof-process isolate*.log
# node --prof-process isolate*.log > out.txt
With @babel/parser:
node --prof ./node_modules/@babel/parser/bin/babel-parser.js fixtures/es5/ember.debug.js > /dev/null
node --prof-process isolate*.logNode.js 12 introduces --cpu-prof to starts V8 CPU Profiler on start up.
# Generate CPU Profile running dev parser on ember,
# This command will output a cpu profile inside the ./cpuprofile directory, i.e. `CPU.20190906.174010.51327.0.001.cpuprofile`
PARSER=dev FILE=ember npm run cpu-prof
Load generated cpu profile to Chrome Devtools, and analyze the performance recording.
node --trace-opt script.js | grep myFunc
node --trace-opt ./node_modules/@babel/parser/bin/babel-parser.js fixtures/es5/ember.debug.jshttps://medium.com/@paul_irish/debugging-node-js-nightlies-with-chrome-devtools-7c4a1b95ae27
Point node to the @babel/parser script and pass in a file to parse
In this case I am running node in
parserwithparser_performance/in sibling folder
cd parser

# node --inspect-brk script.js
node --inspect-brk ./bin/babel-parser.js ../parser_performance/fixtures/es5/angular.js
If you have install NIM, it should open up chrome and show this view: (if not you can open the url shown in the console yourself)

Then click on the "Profiler" Tab

Then click "Start"

Wait a little bit and click "Stop", and you will be redirect to this screen

# Use develop babel to parse material-ui-core fixture, output the bytecode
# generated by ignition interpreter to `parse.bytecode`
FILE=material npm run print-bytecode

# Specify `PARSER` to use baseline babel or other parsers
FILE=material PARSER=babel npm run print-bytecode# Use develop babel to parse material-ui-core fixture, output the optimized dissembly code
# generated by turbofan compiler to `parse.asm`
FILE=material npm run print-code