Can I provide my own stats to stat_compare_means #99
Comments
|
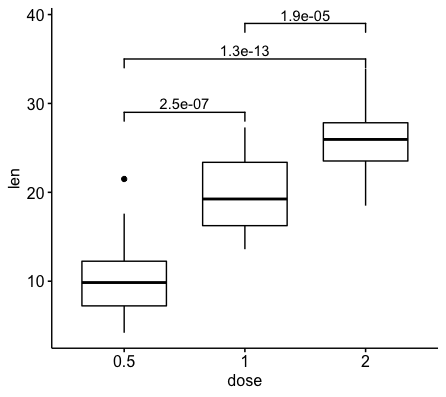
To add manually a p-value onto a ggplot2,
library("dplyr")
library("ggpubr")

# Pairwise t-test between groups
stat.test <- compare_means(
  len ~ dose, data = ToothGrowth,
  method = "t.test"
) %>%
  mutate(y.position = c(29, 35, 39))
stat.test
# A tibble: 3 x 9
.y. group1 group2 p p.adj p.format p.signif method y.position
1 len 0.5 1 1.268301e-07 2.5e-07 1.3e-07 **** T-test 29
2 len 0.5 2 4.397525e-14 1.3e-13 4.4e-14 **** T-test 35
3 len 1 2 1.906430e-05 1.9e-05 1.9e-05 **** T-test 39
# Create a box plot and add the p-value
ggboxplot(ToothGrowth, x = "dose", y = "len") +
  stat_pvalue_manual(
    data = stat.test, label = "p.adj",
    xmin = "group1", xmax = "group2",
    y.position = "y.position"
    )
|
|
Awesome! thanks |
|
so we can close this issue... |
This was referenced Jul 10, 2018
Sign up for free
to join this conversation on GitHub.
Already have an account?
Sign in to comment
Hello!
thanks for developing ggpubr.
Stat_compare_meansis particular awesome to add stats onto ggplot2 beautifully.However, I wondering is there a way to put a subset of
compare_means()output object onto my ggplot2? I couldn't do it withstat_compare_means, for that it would change the p-values by assuming less comparisons than supposed, while more comparisons are done and I just want to plot subset of the statistics.Can this be done easily somehow? Any insight would be helpful.
Thanks
The text was updated successfully, but these errors were encountered: