
Project to monitor all running docker containers and all main resources from a machine using grafana and prometheus

First tag your containers groups in your docker-compose.yml files with the label container_group for each service you want do filter and run docker-compose up -d for each one
    labels:
      container_group: your-group-name
Now run the monitor
Requires Docker and Docker Compose tool.
docker-compose up -dThe default user and password to login in Grafana are: User admin and Password admin
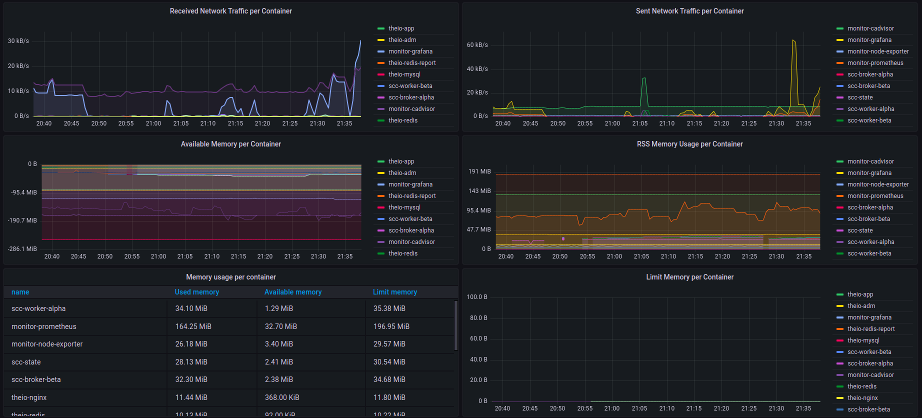
Grafana is expose on port 3000 and you can access your dashboard here
You can filter all containers data by your container groups
Prometheus is expose on port 9090 and you can access all metrics here
The agents used for this project are Node Exporter and cAdvisor.
For config in Grafana like allow embedding graph or other config you can access and update grafana.ini.
You can change the default dashboard configurations in docker.json.
For update or add another datasource type you can use datasource.yaml
For new dashboards you can just create another json in dashboard folder
Want to contribute? Great!
Kiwfy - Open your code, open your mind!