I have created a line graph that shows the JVM's heap memory usage over a period of time, the update frequency is 2 seconds. I have configured the x-axis line chart as below,
xyChart.getStyler().setDatePattern("DD/MMM - HH:mm:ss");
My date datapoints are coming from this object,
nodeRunTime = currMemObj.currNodeRunTime;
and I am adding that to chart as below,
usedHeapSeries = xyChart.addSeries(Ser1_UsedHeap, nodeRunTime, usedHeapMemData);
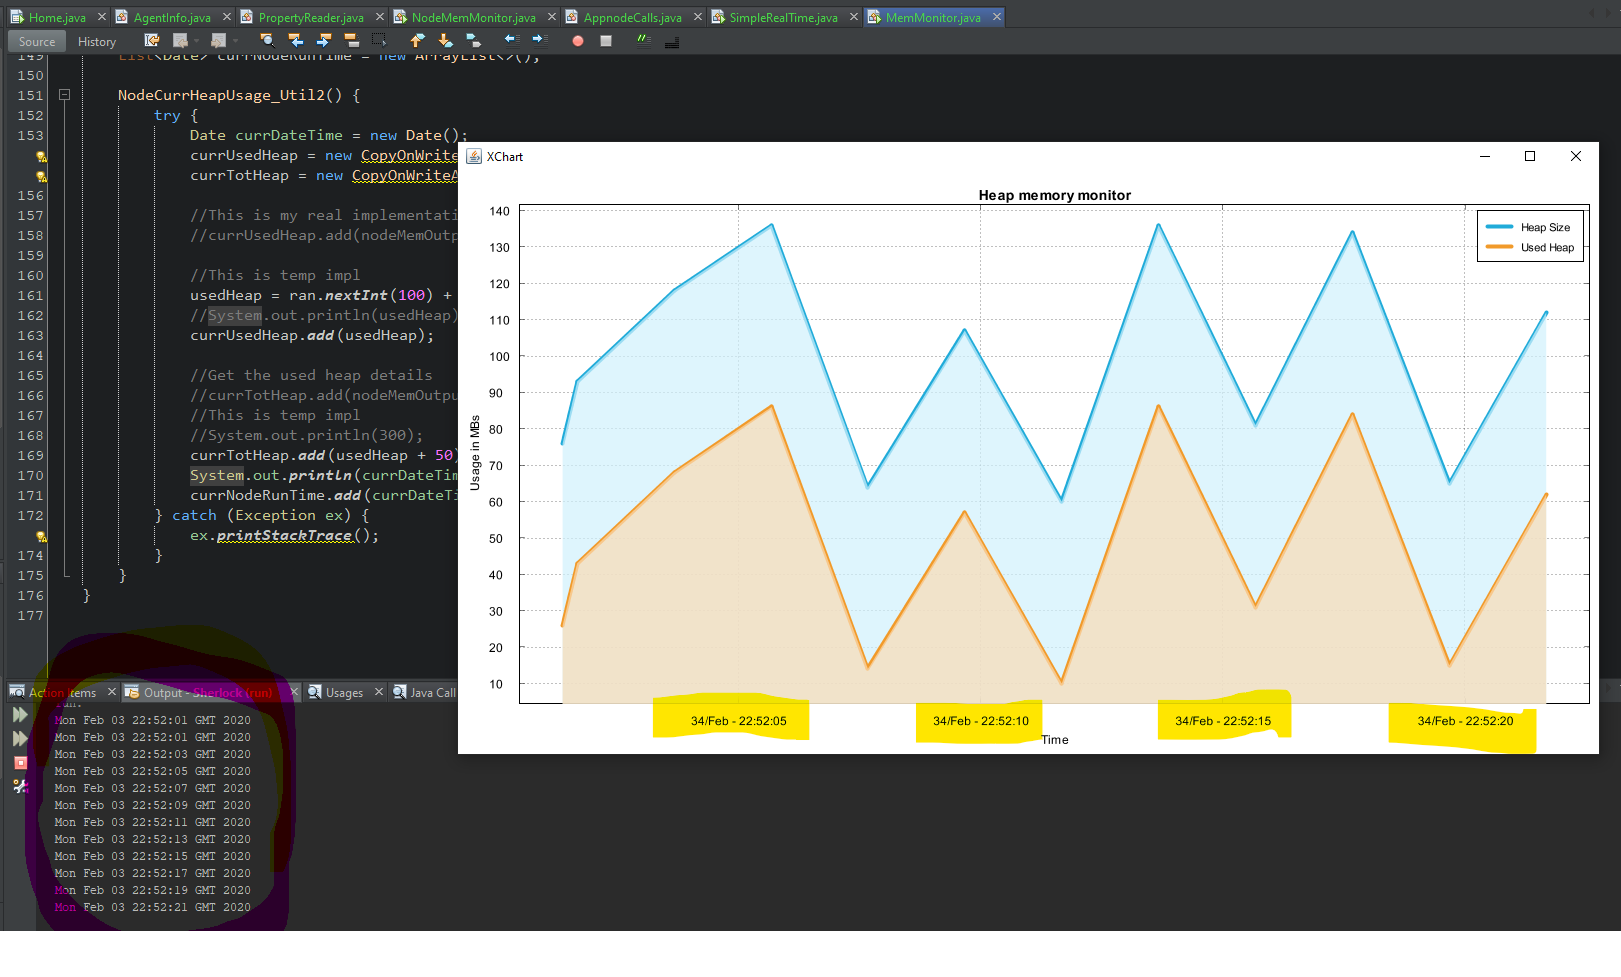
With this configuration, when I run the chart, I can see a date coming as below:
(note the date is displayed as 34 Feb when the actual date is 3 February. In the console, correct date is printed)
When I checked the actual date that I am passing, I found it is being collected correctly but not being displayed in the proper format. Is this a defect? Am I missing something? Reproducible test case is attached here.
398_code.zip
Thanks!
I have created a line graph that shows the JVM's heap memory usage over a period of time, the update frequency is 2 seconds. I have configured the x-axis line chart as below,
xyChart.getStyler().setDatePattern("DD/MMM - HH:mm:ss");My
datedatapoints are coming from this object,nodeRunTime = currMemObj.currNodeRunTime;and I am adding that to chart as below,
usedHeapSeries = xyChart.addSeries(Ser1_UsedHeap, nodeRunTime, usedHeapMemData);With this configuration, when I run the chart, I can see a date coming as below:
(note the date is displayed as 34 Feb when the actual date is 3 February. In the console, correct date is printed)
When I checked the actual date that I am passing, I found it is being collected correctly but not being displayed in the proper format. Is this a defect? Am I missing something? Reproducible test case is attached here.
398_code.zip
Thanks!