PyN2 is a Python library (based on OpenMDAO project), designed to easily create dynamic n-squared (N²) charts. N² charts are essential in systems engineering and project management to visualize and manage complex interactions between components, subsystems, or processes. PyN2 provides an intuitive API to generate customizable N² diagrams.
- Generate n² charts to visualize component interactions
- Customizable labels for rows and columns
- Highlight important relationships and dependencies
- Export charts in various formats (e.g., SVG, HTML)
- Easy-to-use API with minimal setup
- Systems engineering: Interface mapping and interaction management
- Project management: Task dependencies and relationship tracking
- Complex system design: Visualizing module communications and dependencies
pip install pyn2PyN2 relies on the following dependencies, which are managed through Poetry:
[tool.poetry.dependencies]
python = "^3.12"
openmdao = "^3.34.2"Run the following code to generate the gen_diag.html file.
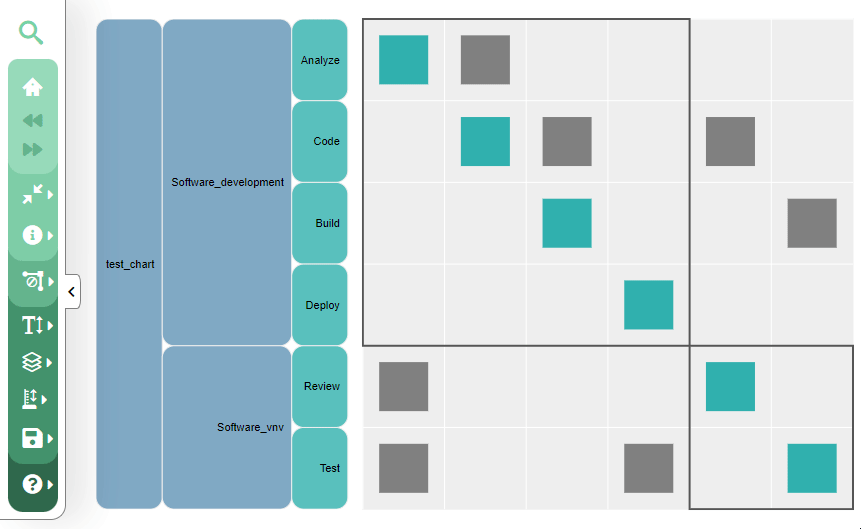
from pyn2.chart import Element, Group, N2

n2 = N2('test_chart')
s_dev = Group('Software_development')
e_analyze = Element('Analyze')
e_code = Element('Code')
e_build = Element('Build')
e_deploy = Element('Deploy')

t_vnv = Group('Software_vnv')
e_review = Element('Review')
e_test = Element('Test')

e_analyze.connect_to(e_code)
e_code.connect_to(e_build)
e_code.connect_to(e_review)
e_review.connect_to(e_analyze)
e_build.connect_to(e_test)
e_test.connect_to(e_deploy)
e_test.connect_to(e_analyze)

s_dev.add_element(e_analyze)
s_dev.add_element(e_code)
s_dev.add_element(e_build)
s_dev.add_element(e_deploy)

t_vnv.add_element(e_review)
t_vnv.add_element(e_test)

n2.add_group(s_dev)
n2.add_group(t_vnv)
n2.generate_report()
And produce the following chart:
See CONTRIBUTING
Developed with ❤️ by the internet
Mainteiner: Leonardo Mariga
Did you like it? Remember to click on 🌟 button.