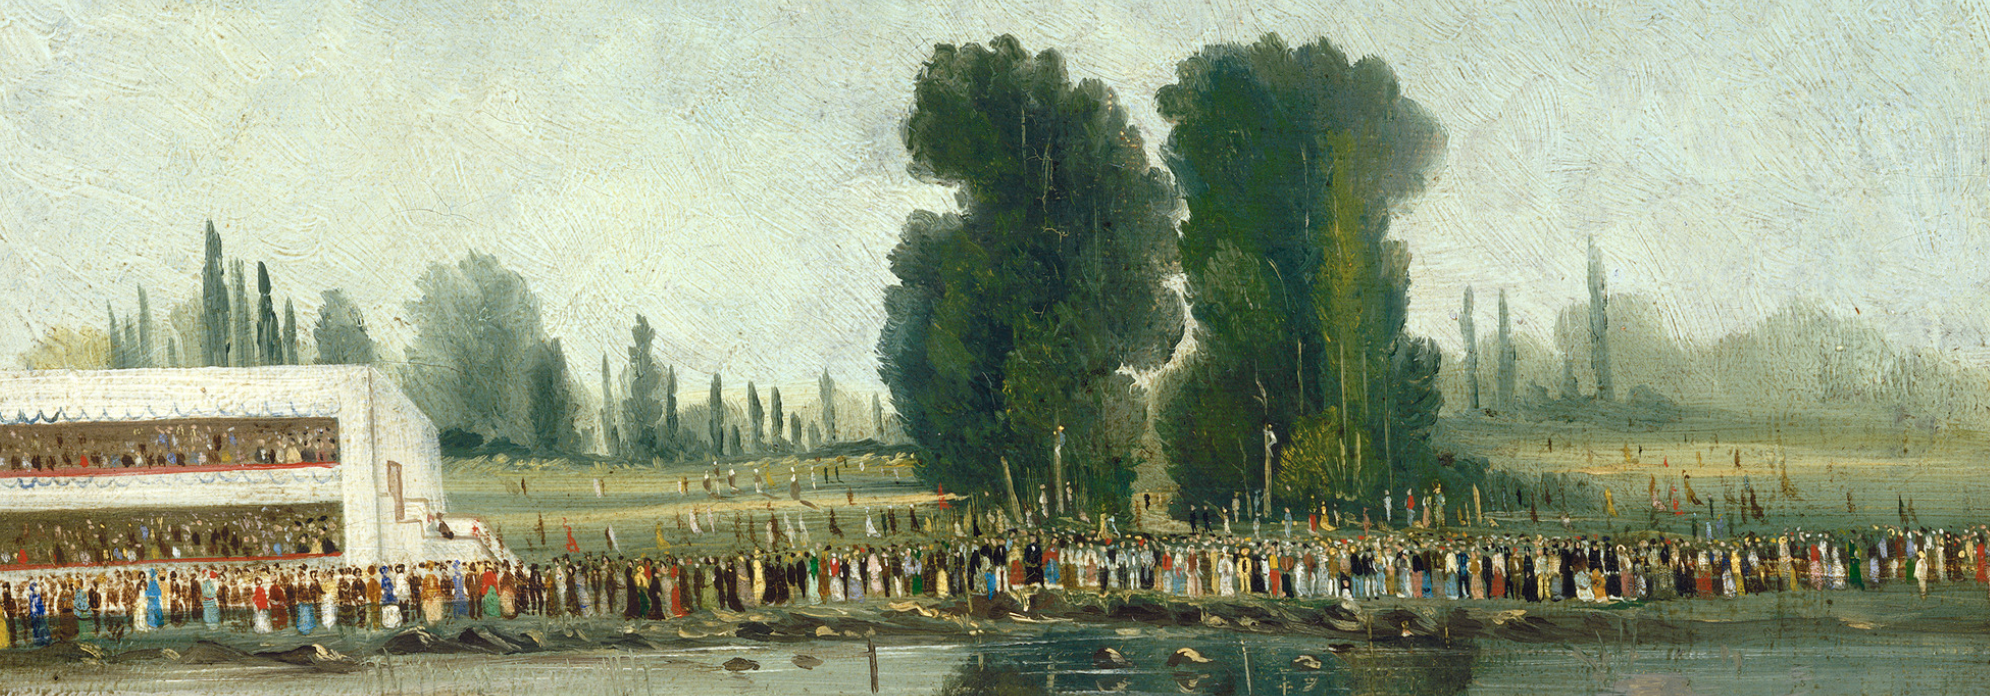
Characterisation of the population of beings of Riverworld.
Riverworld is a fictional planet and the setting for a series of sci-fi books written by Philip José Farmer. Riverworld is an artificial environment where all humans (and pre-humans) ever born who died after reaching 5 years old are reconstructed. Most of the resurrected awaken in a body equivalent to that of their 25 year old selves, in perfect health and free of any previous genetic or acquired defects.
A friend of mine made fun of the book concept and claimed half of the beings ressucitated would be prehistorical.
This project is proving him wrong.
- Begining of mankind : Homo Erectus, -1500K, assuming all beings on Riverworld can walk
- End of mankind : 2016. In the book, all people die in 1983 after interacting with an alien civilisation.
- Child Mortality CM : death of infants and children under the age of 5
- Infant Mortality IM : death of infants and children under the age of 1
- Life Expectancy LE : average time a being is expected to live
- Life Adult Expectancy LAE : average time a being is expected to live if he reachs 5 years old
- Dataset compiled amongst considered sources :
- until now, conservative estimations for pre modern times :
./data/population-min.csv - until now, optimistic estimations for pre modern times :
./data/population-max.csv - until now, average estimations for pre modern times :
./data/population-avg.csv - including 2070 projections
./data/population-future.csv
- until now, conservative estimations for pre modern times :
- The dataset consists of Point In Times (PIT)
- For each PIT, these metrics are available : year, beings count in millions, LE, LAE, CM and continental proportions
- Depending on sources, CM, IM, LE and/or LAE are provided or not. Some datas have been extrapolated. Underlying model : LE = CM * 5/2 + LAE * (1 - CM)
- Case of beings count in prehistorical times :
- Beings counts estimation flucuates a lot. They can go as low as 1K individuals up to 100K
- We have 3 milestones in our dataset : -1500K (lower paleolithic), -50K (higher paleolithic) and -10K (begining of history)
- For -10K, the poulation count is within the magnitude of the millions according to most of the sources. We kept the McEvedy estimation of 4 millions.
- For -50K, we kept the higher estimation of Jean-Pierre Bocquet-Appel from his study of upper paleolithical meta populations in Europe. He found 15K individuals in the Aurignacien (-30K). Wordlwide, we estimated, as a minimum, we timed this result by 5. As a maximum by 10.
- For -1500K, we've assumed the population could not be higher than in -50K. We assumed the population at that time would be the population of -50K / 2.
- Case of LE et CM for prehistorical times :
- As for beings counts, the LE estimations vary greatly
- The Kaplan study suggest hunter gatherer modern societies tell us how prehistoric men lived and died. The study suggests the ALE is around 50 years and the CM around 0.5
- For reference, the CM of 1900 is 0.4 and the Scheidel estimation of Classic Rome CM is 0.5
- We cowardly derived the CM of pre Roman times to 0.6
- Linearity in between PITs :
- The underlying assumption is that the PIT metrics evolve linearly in between two PITs
- This assumption can be considered true from -1500K to 1700, from 1700 to 1900, from 1900 to 1950 and from 1950 to today
- The PIT resolution in the dataset is consistent with this observation
- We then assume numerical midpoint integration is a reasonable estimation
- For the period PIT 1 => PIT 2
- AB yx = Amount of Beings for year x
- Elapsed Time ET = y2 - y1
- Average Amount of Beings for Period AABP = (AB y2 + AB y1) / 2
- LAE for Period LAEP = (LAE y1 + LAE y2) / 2
- Proportion of Adult Beings To Be for Period PABTBP = 1 - ((CM y1 + CM y2) / 2)
- Thus Amount of Beings who were Born for Period ABP = ET * AABP / LAEP
- Thus Amount of Adult Beings who were Born for Period AABP = ET * AABP * PABTBP / LEP
- Another calculus method is to use a simpe model of population growth :
- AB y1 = Ce^(r * y1) and AB y2 = Ce^(r * y2)
- By integration, ABP = ET * (AB y2 - AB y1) / (ln(AB y2) - ln(AB y1)) / LEP
- This method proved to be very similar to the naïve numerical integration we selected (cf Report - Figure 6)
- The last report :
./output/(min|max|future)/report.pdf - The last plots :
./output
- https://en.wikipedia.org/wiki/Human_evolution
- https://ourworldindata.org/child-mortality
- https://ourworldindata.org/infant-mortality
- https://en.wikipedia.org/wiki/Life_expectancy#Variation_over_time
- https://en.wikipedia.org/wiki/World_population#Past_population
- https://ourworldindata.org/world-population-growth
- http://www.unm.edu/~hkaplan/KaplanHillLancasterHurtado_2000_LHEvolution.pdf
- https://en.wikipedia.org/wiki/Prehistoric_demography
- https://en.wikipedia.org/wiki/World_population_estimates
- http://www.evolhum.cnrs.fr/bocquet/jas2005.pdf
- https://www.princeton.edu/~pswpc/pdfs/scheidel/040901.pdf
- https://scholarspace.manoa.hawaii.edu/bitstream/handle/10125/17288/AP-v47n2-190-209.pdf
- https://ourworldindata.org/world-population-growth
- http://www.math.hawaii.edu/~ramsey/People.html
pip install --upgrade pippip install -r requirements.txt --user- Fonts used in this project :
./resources/fonts - PDF dependencies :
- mac :
brew cask install wkhtmltopdf - linux :
apt-get install wkhtmltopdf
- mac :
- Configuration is loaded from
config.ini python riverworld.py min|max|avg|future- all at once :
python riverworld.py min;python riverworld.py max;python riverworld.py avg;python riverworld.py future
- Author : Lucas Mouilleron, http://lucasmouilleron.com
- Thanks to : Jean-Benoît Bourron, Romain Charlassier
