Recording all OC methods in the main thread takes time
大家对TimeProfiler有什么建议或者需求或遇到crash等所有事情,强烈欢迎到Issues去留言。
目前已经支持显示调用堆栈。
支持super函数的统计
重大更新:仿照os_signpost,用户在一个功能的开始调用TPStartTrace,在结束地方调用TPStopTrace。具体用法见下面👇
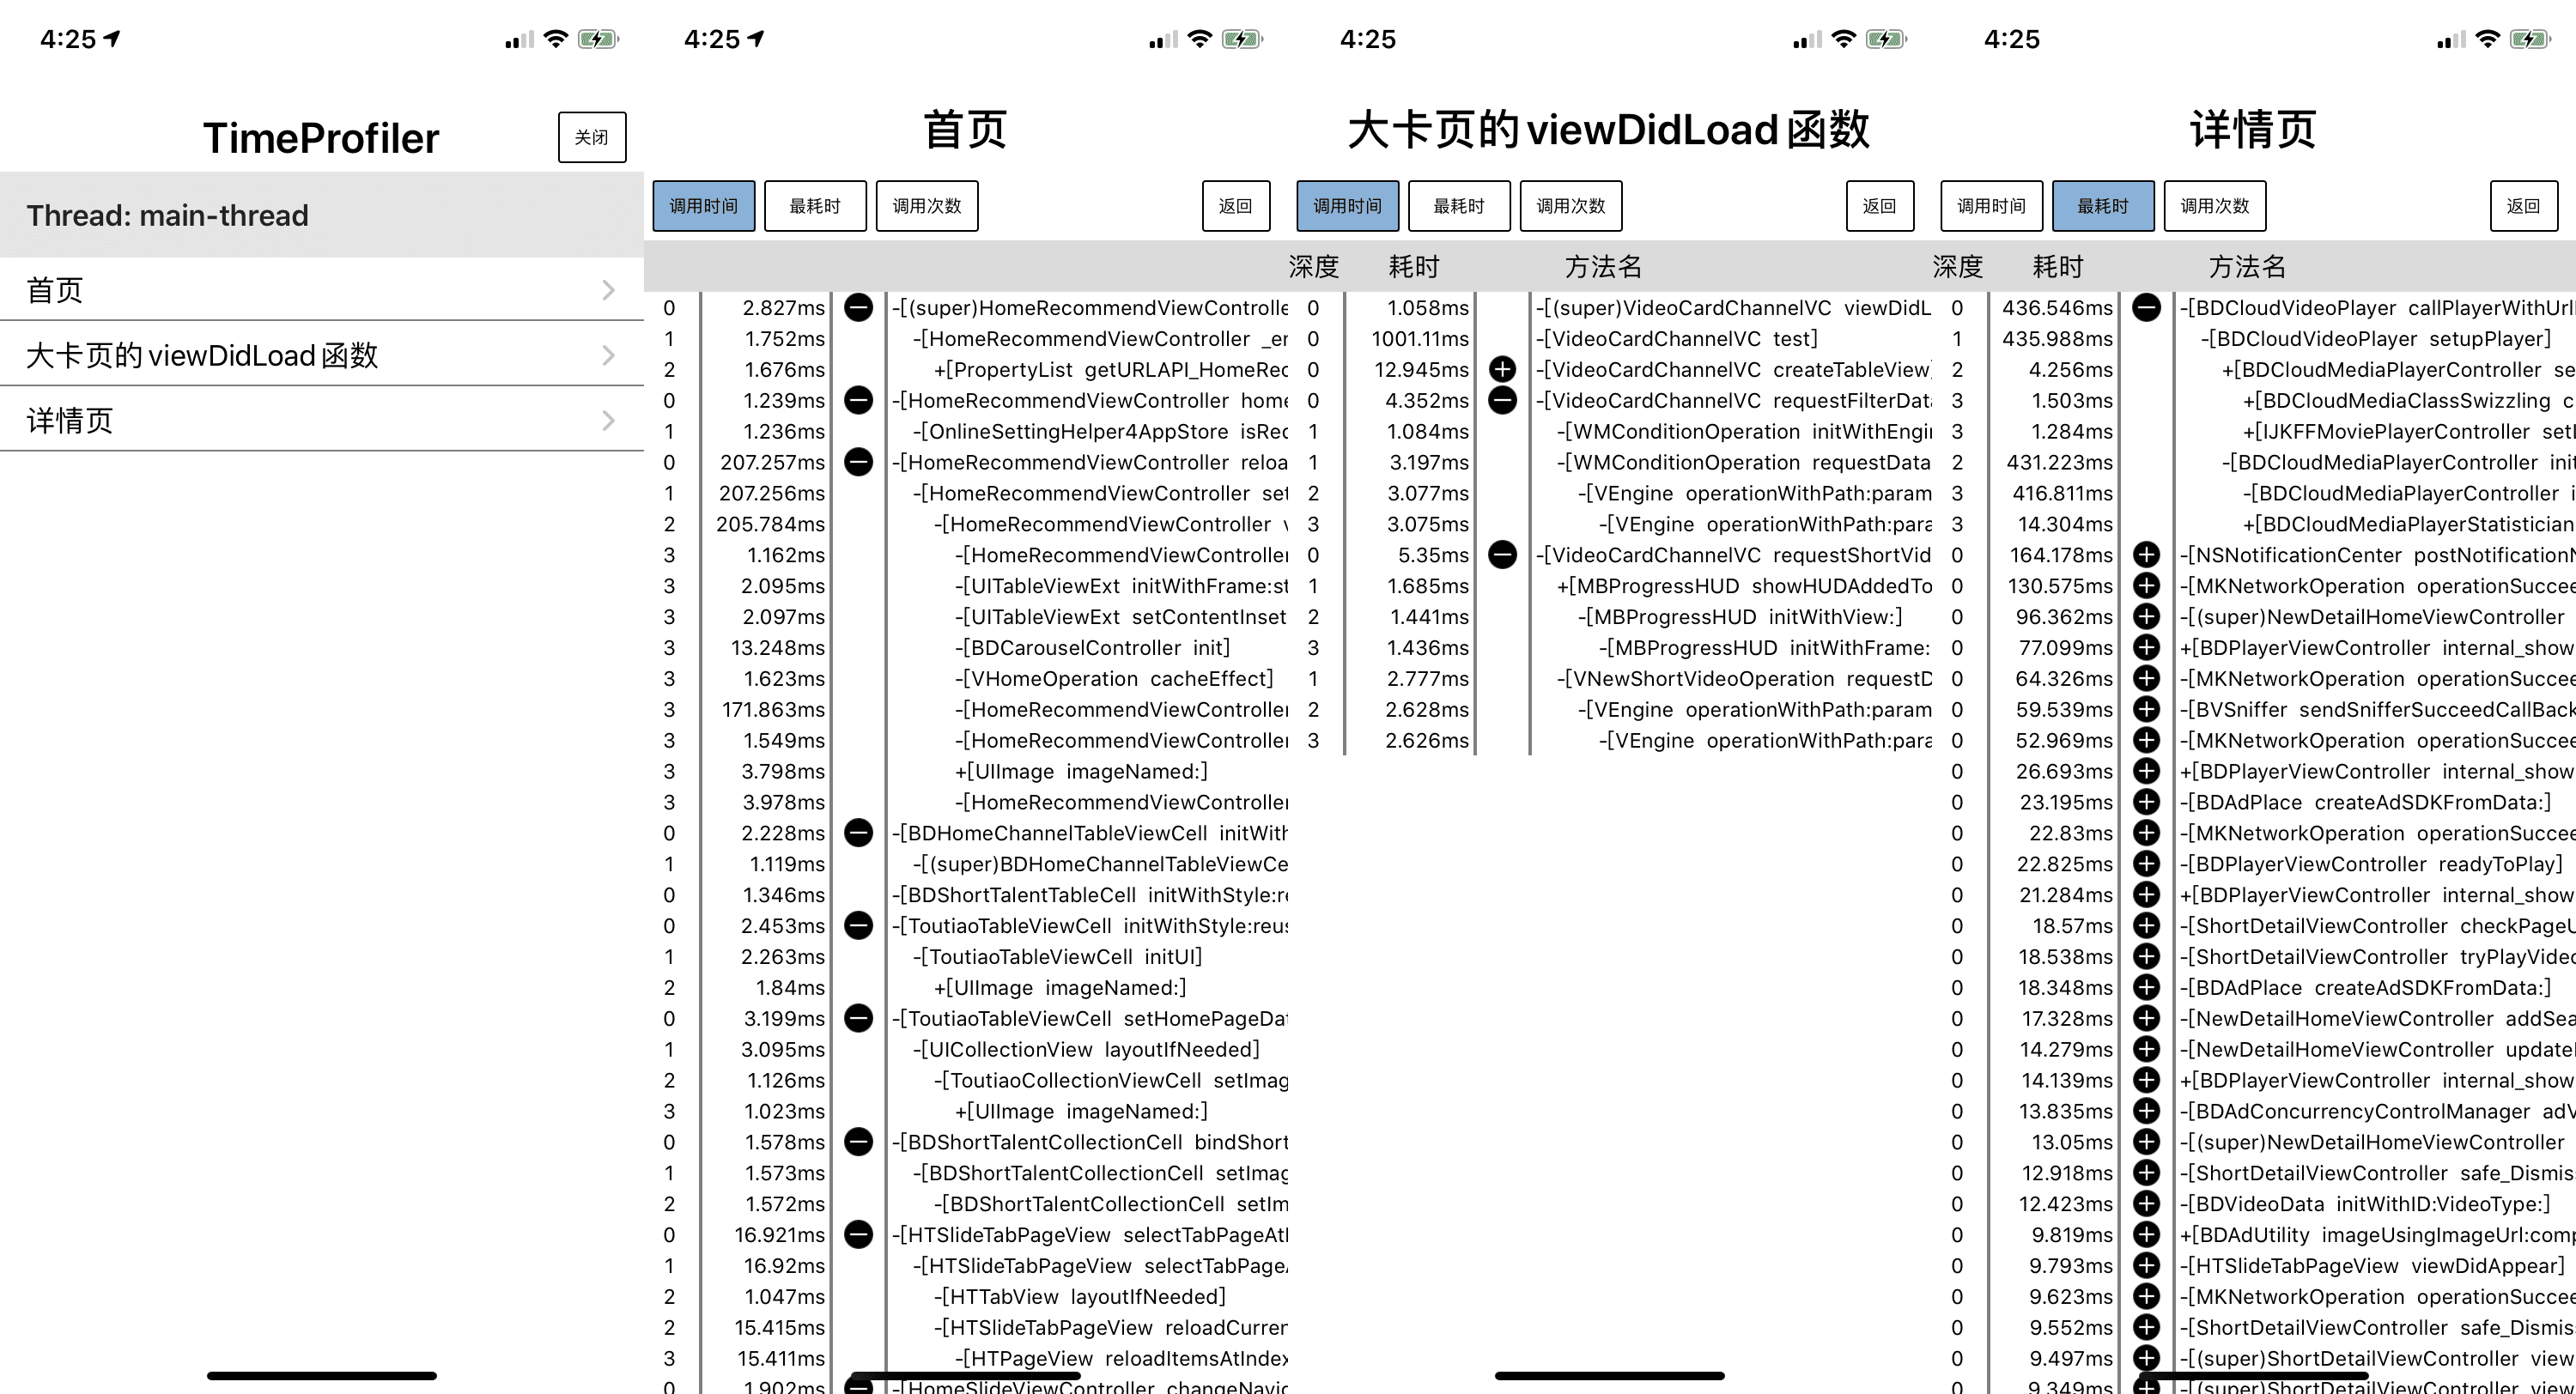
- 记录所有在主线程运行的OC方法的耗时情况
- 支持设置记录的最大深度和最小耗时
- 显示调用堆栈
- 支持super函数的统计
- 支持在程序中多次监控,类似os_signpost
iPhone5s及更新真机(arm64)
//一个函数耗时统计
- (void)viewDidLoad {
    [[TimeProfiler shareInstance] TPStartTrace:"大卡页的viewDidLoad函数"];
    ...
    [[TimeProfiler shareInstance] TPStopTrace];
 }

 //一个页面/功能点的耗时统计
 [[TimeProfiler shareInstance] TPStartTrace:"详情页"];
/* 中间可以跨多个函数或模块*/
 [[TimeProfiler shareInstance] TPStopTrace];


 /**
 开始/停止统计,需成对使用
 可以用来测多个功能点的耗时问题
 */
- (void)TPStartTrace:(char *)featureName;
- (void)TPStopTrace;

- (void)TPSetMaxDepth:(int)depth; //默认3;不调用的话,默认是3
- (void)TPSetCostMinTime:(uint64_t)time; //单位为us,1ms = 1000us;不调用的话,默认是1000us
- (void)TPSetFilterClass:(NSArray *)classArr; //需要过滤的类,不调用此方法,默认为TimeProfilerVC、TPRecordHierarchyModel、 TPRecordCell、TPRecordModel等TimeProfiler本身类(不统计过滤的类)
把TimeProfiler文件夹放入项目中,run App后,摇一摇App,就可以看到主线程运行的OC方法的耗时情况