Matplotlib plt.Rectangle Incoherent Results #12335
Comments
|
Set the linewidth property of all your Rectangles to 0 ( |
|
Yes ! This fixes the problem ! Thanks a lot !! |
|
The line is 1 pt wide and 0.5 pt overlaps your rectangle edge. You were making plots so small this was visible. |
|
I understand ! Thank you so much !! 👍 |
|
I don't think you did anything wrong nor do I think this is a bug, just that the default behavior is not what you needed. By default patches (of which Another tricky thing about this is that the position and shape of the rectangle is specified in data-units, but the thickness of the border is in absolute units (pts, which are 1/72 of an inch). If you zoomed in by changing the axis limits (rather than by zooming in on the pdf) you would have gotten different results. |
|
@tacaswell Thanks a lot for your comment and your helpful explenation !! |
Bug report
Bug summary
Matplotlib plt.Rectangle does not produce coherent pdf results: Overlap where there should be none !
Maybe other shapes have the same issue.
Code for reproduction
Actual outcome
This seems okay, but when I increase the length of the top blue rectangle to 2000:
Zoom in:
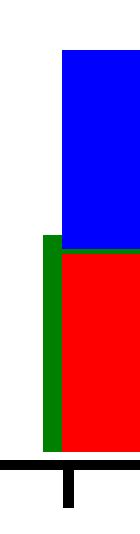
The overlap gets worse with the increasing length along x-axis.
See: https://stackoverflow.com/questions/52518140/weird-behavior-of-matplotlib-plt-rectangle?noredirect=1#comment91989045_52518140
Matplotlib version
- Operating system: Windows 10
- Matplotlib version: 2.2.2
- Matplotlib backend (
- Python version: 3.5
- Jupyter version (if applicable): 1.0.0
conda defaultprint(matplotlib.get_backend())): module://ipykernel.pylab.backend_inlineThe text was updated successfully, but these errors were encountered: