Stack trace from throw in debug console should hide everything below "eval" #1259
Comments
|
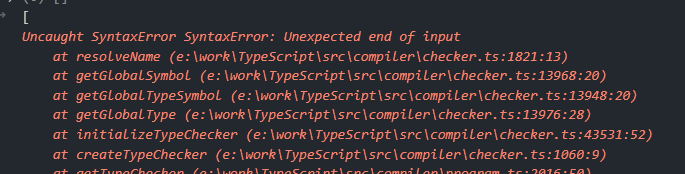
Just so you can see how huge I'm talking about, this is what I get on a regular basis debugging TS... Details |
|
I also swear this used to not be the case at all; the huge stack traces are something that I only started seeing recently, so maybe this is a bug and this is supposed to be working as I describe. |
|
Fair suggestion, should not be terribly hard, we already have a stacktrace parser. Code pointer: vscode-js-debug/src/adapter/threads.ts Lines 520 to 523 in 0d435a1 |
|
Interesting, thanks for pointing that out. I imagine we'd need to know exactly which |
|
The code path I linked deals with the response from a REPL evaluation. However, yes, we need to know what frame in the stack was the expression. One way to do this would be to name the sources ahead of time by appending a |
|
I have it working; will send something on Monday.
|

|
This has been working great, but I did notice that syntax errors aren't caught in the same way; the REPL frame doesn't seem to be in the trace when that happens, confusingly. |
|
It makes a bit of sense: we append |
|
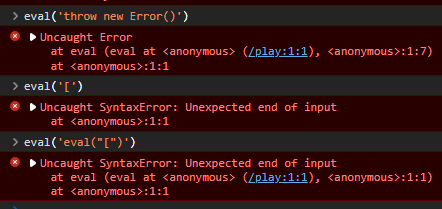
Even weirder, in that
You can see this if you just try using eval; the best one can do is to wrap the eval in another eval:
But, that's not very helpful for traces when there isn't a syntax error as eval would be doubled. I would really think that these types of errors would include |
|
Why Chrome/Edge's debugger gets an I can file a bug for syntax errors to not keep talking on a closed issue; I forgot to test syntax errors when I was working on my PR to close this issue. |
|
@connor4312 Was the fix for this reverted at some point? I back to getting huge backtraces when I make typos. |
|
I've anecdotally seen this, but of course now that I try to reproduce it, am having trouble hitting it. If you hit this again before I do, can you share where you were and the contents of your debug console? |
|
I also somehow cannot reproduce it. Very confusing. I will keep my eye out and get some sort of backtrace the next time it happens. |
|
Just had it happen; I was given this trace: Half related, but |
|
Actually, that is relevant. This only happens when the renaming is wrong. If I type |
|
Reported as #1542. |
|
It's our old friend sourcemap renames: in renaming identifiers, the program is re-generated from its AST, and Acorn is not aware of comments, so the sourceURL is not set in any expression that uses a renamed identifier |
* fix: repl stacktrace with renames showing too much info

Fixes #1259

* fixup! tests
|
Confirmed that it's showing long call stacks in VS Code Stable but not in Insiders. |
Is your feature request related to a problem? Please describe.
When I do something in the debug console that throws, I get a huge massive error message, which I have to scroll all the way past to figure out what I did wrong (99% of the time, I've hit enter instead of tab when trying to auto-complete; that's a different problem).
Describe the feature you'd like
The stack trace that is shown for errors that are thrown should drop anything past the eval, since that's where the executed code is actually rooted from. Nothing below eval in the trace string is really controllable; that's just where you are in the debug session.
Anything
evaland "above" is what should be kept, so you can see errors thrown from functions called from the console, like:The text was updated successfully, but these errors were encountered: