


Visual Studio Code (VS Code) extension that makes it easy to debug code on a remote host by using a generic way.
In many scenarios you are not able to install debuggers like XDebug.
Another (additional) reason could be, that you and your constributors work on the same server for different reasons.
This is why you need a simple way to debug your code in VS Code on many systems with an optional list of constributors and the possibility to send data over a TCP socket to you.
The extension listens on a TCP port and waits for binary packages (debug messages) which contain UTF-8 formatted JSON data with all debug information that should be displayed in your editor.
The system / server you would like to debug has to send these information to your debugger instance when it is executed.
The extension stores these information and makes it possible to switch between all received debug messages.
Launch VS Code Quick Open (Ctrl+P), paste the following command, and press enter:
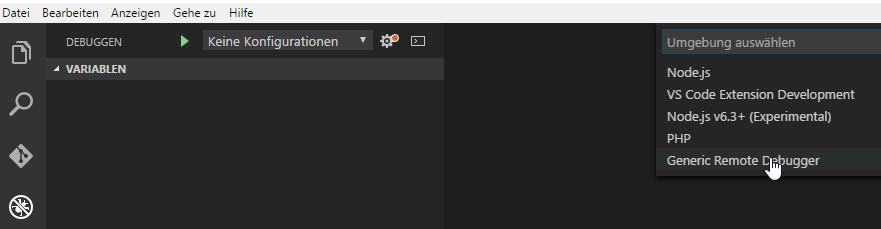
ext install vs-remote-debuggerOpen the root directory of the project you would like to debug and select the environment Generic Remote Debugger:
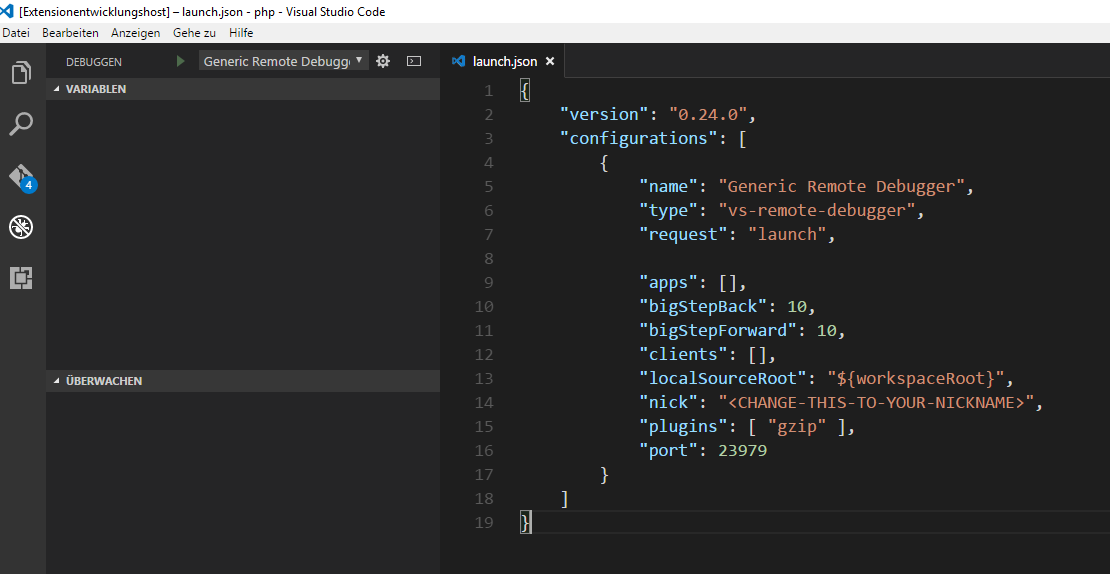
Customize the initial configuration (if needed):
And start debugging:
The following environments and frameworks are supported:
- PHP (php-remote-debugger)
- Node.js (node-remote-debugger)
The implementation of such a debugger message is quite simple.
The first 4 bytes store the length of the JSON data. It represents an unsinged 32-bit value in little endian order. In Node.js it looks like this:
// 'binaryPackage' is a Buffer object
let jsonLength = binaryPackage.readUInt32LE(0);
The rest contains the JSON data with the debug information:
// at offset 4, the JSON data starts
let json = binaryPackage.toString('utf8',
                                  4,
                                  jsonLength + 4);

// RemoteDebuggerEntry (s. below or 'debugger.ts')
let debugMessage: RemoteDebuggerEntry = JSON.parse(json);
Look at the following interfaces in the contracts.ts to get an idea how a message is structured:
| Name | Description |
|---|---|
| RemoteDebuggerEntry | The whole JSON message. |
| RemoteDebuggerThread | A thread. |
| RemoteDebuggerStackFrame | A frame of a stacktrace. |
| RemoteDebuggerScope | A scope of a stack frame. |
| RemoteDebuggerVariable | A variable. |
Additional you should look at the RemoteDebugger class to see how a server machine sends data to Visual Studio Code.
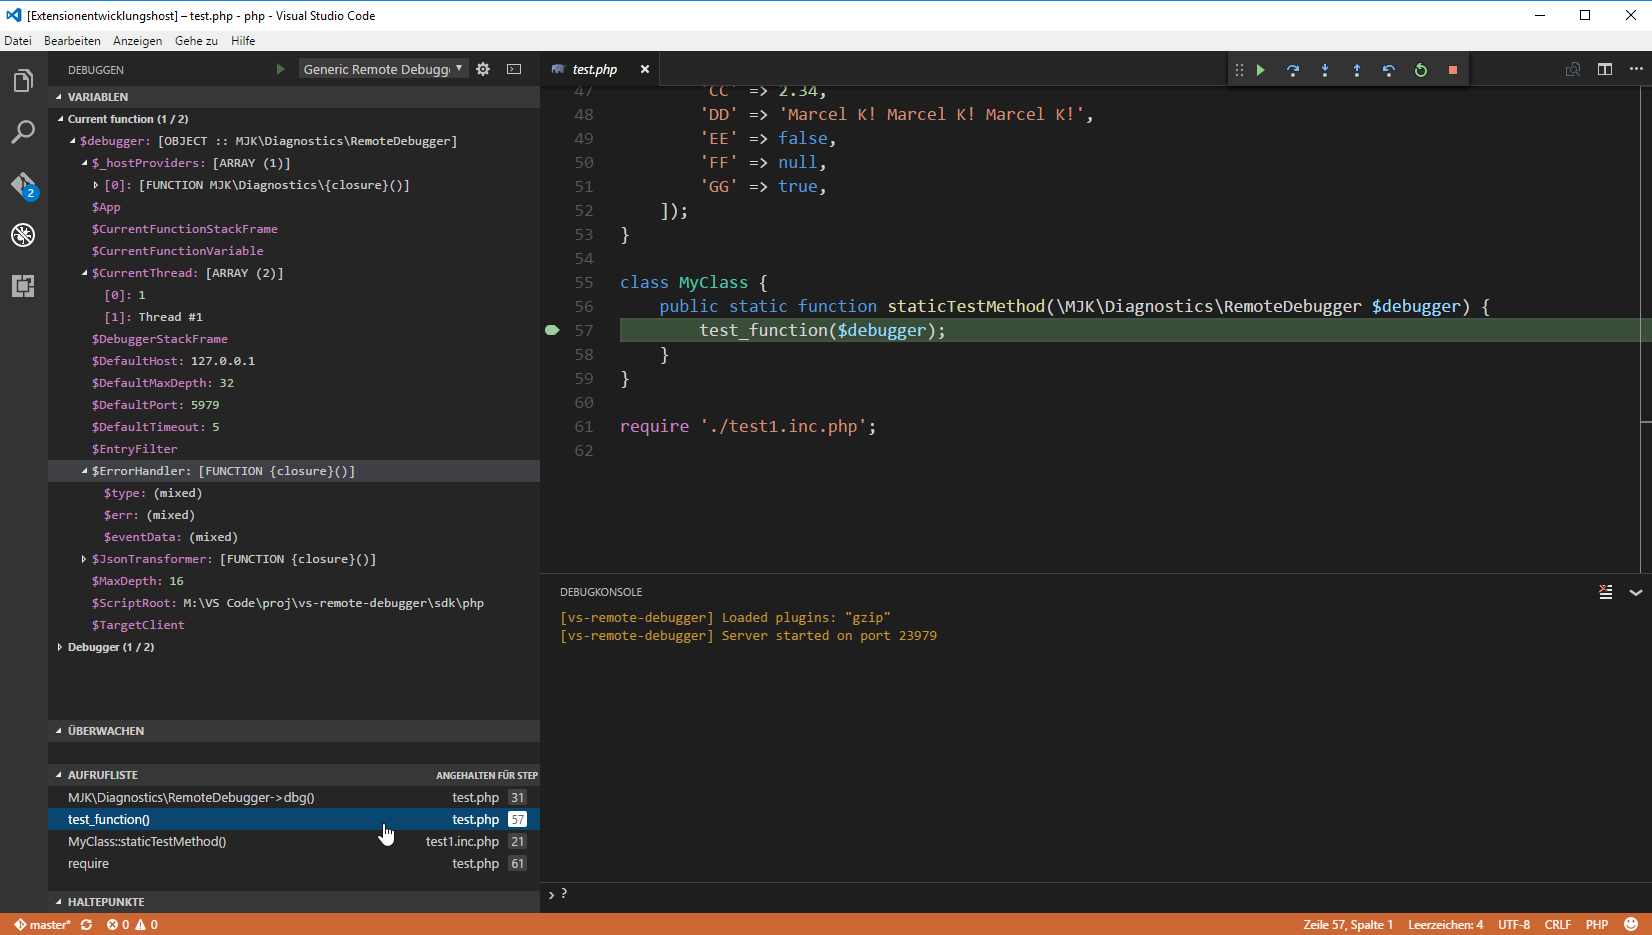
If you run the test.php script from the PHP SDK, a possible message can look like this:
If the debugger instance is running, you can use the "Debugger console" (CTRL + SHIFT + Y) of VS Code which provides a lot of handy and useful commands:
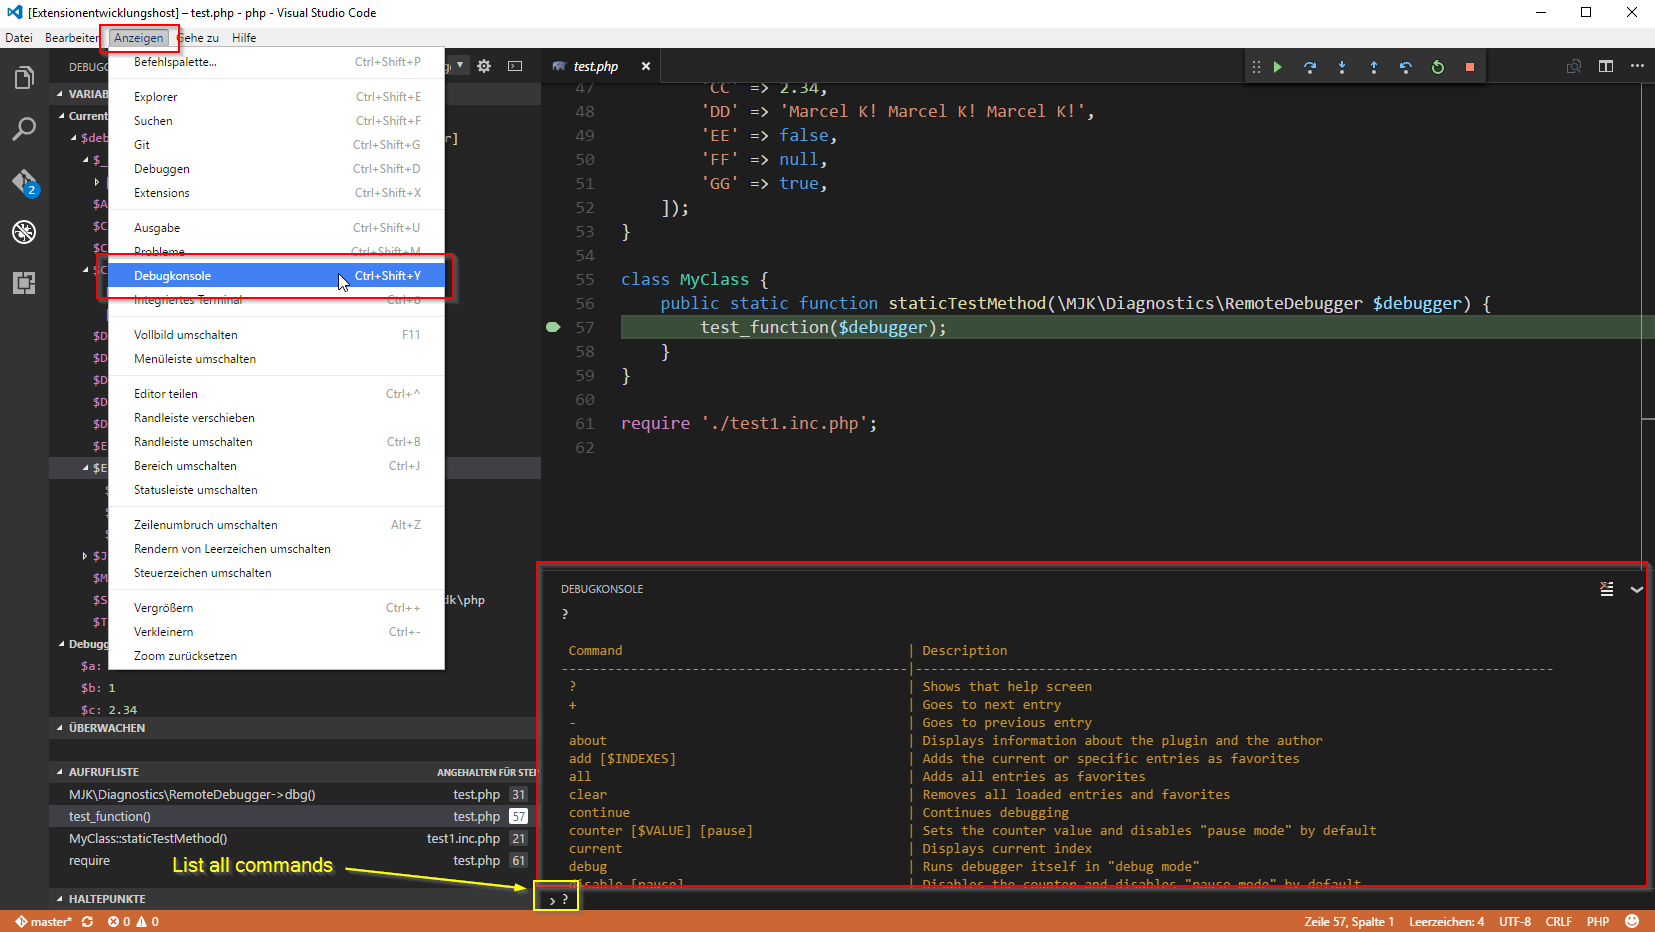
Input ? inside your "command field" if you would like to display all available commands that are provided by the debugger.
A complete list of commands with detailed descriptions and examples, can be found at the wiki or you can use the help command in the debugger console to open a wiki page directly.