This is my Capstone project for my Udacity Data Scientist course.
My Blog Post on Blogger.com can be found here: https://nameisunique.blogspot.com/2020/07/should-i-stay-or-should-i-go.html
Sparkify is Udacity's (on paper...so far) music streaming service that produces data similar to Spotify or Pandora. Users play and/or rate their favorite songs through such services on a daily basis. The business model employed is a free and pay tiered system where free/unpaid users have generally limited access and often see advertisements to offset the royalty fees paid to music artists. Users have the ability to upgrade their service (become a paying customer), or downgrade their service (from paying to non-paying); both tiers have the ability to cancel their service, and that lost of a customer would be considered "customer churn".
All user interaction with Sparkify revolves around these activities:
- Play a song
- Creating and updating playlists
- Rating song with the thumbs up or thumbs down button
- Add a friend
- Logging in or out
- Changing settings
Each of these activities generates an entry into the user logs. Naturally, log analytics are a key factor for the Sparkify marketing team and all the executive staff. The team at Udacity has provided a test dataset for our analysis, although little documentation has been provided on the dataset.
Realistically, there is one main question we want to answer: Will either a paying or free user leave? That is called churn and apps like Sparkify live and die by the churn rate.
Along the way, I'll load and examine to data looking to clean the dataset for further examination. After this, EDA (Exploratory Data Analysis) will take place to better understand the data and prepare it for creating several machine learning models that will help to understand which customers are likely to churn.
I'll be looking for the best "F1" score, which is a measurement of the accuracy of a data model to evaluate the best model. After that, I'll present my conclusions along with ideas for further improvement.
This project digs deep into Big Data, Pyspark, Python combined with SQL, along with examining user data from Sparkify. Sparkify is Udacity's (on paper) online music portal, letting both free and paid users play music, create playlists, invite friends, and overall have a great online music experience.
The goal of this project centers around one main question: Who will churn? Sparkify wants to keep both it's paid and free customers, and those that leave are considered to have "churned". Machine Language models come to the rescue to help identify users most likely to churn.
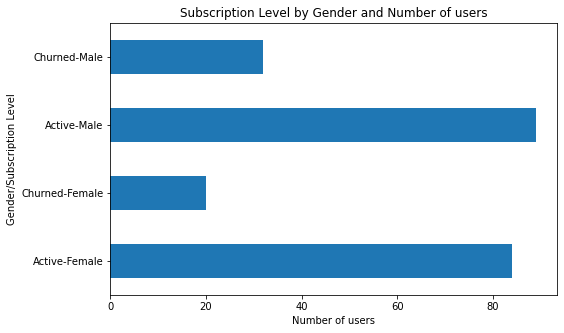
I've used a variety of Python and Pyspark functions to Wrangle the data and the the Exploratory Data Analysis. I've also used a collection of matplotlib and seaborn visualization functions. For example, looking at churn and gender, I produced this type of visual...it's compact, easy to read and understand at a glance, and very quick and easy to implement in my code:
I'll also use a several of the Pyspark libraries to do feature engineering, model building and evaluation, and model tuning.
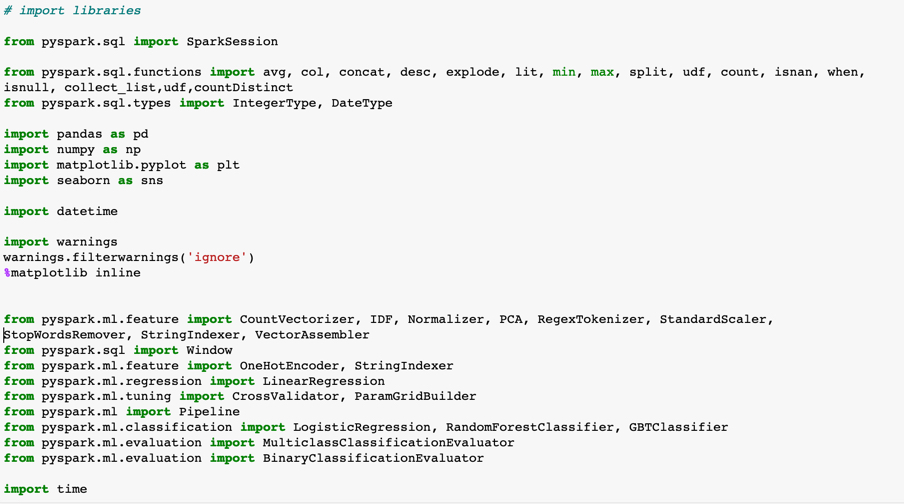
This project will use data provided by Udacity as the basis for the examination per the rubric. I've used Python 3.7 and Pyspark 2.4.3 and created the notebook using Jupyter.
I'm using the following libraries and of note will be the addition of the Pyspark libraries:
- from pyspark.ml.feature: Getting the features engineering functions
- from pyspark.sql: For using SQL functionality in Pyspark
- from pyspark.ml.tuning: Used to create the inputs to the pipelines used by the ML models
- from pyspark.ml: The Pyspark pipeline functionality
- from pyspark.ml.classification: The Pyspark classification models I used
- from pyspark.ml.evaluation: Once the model runs, use these functions to pull out and view the results and metrics