Recently I upgraded from 2.1.0 to 2.4.0. I have line charts with min = 0 & max = 1024. When series include values near the "Max" margin, labels on the axis get overlapped (top-left):
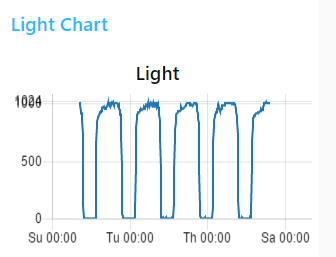
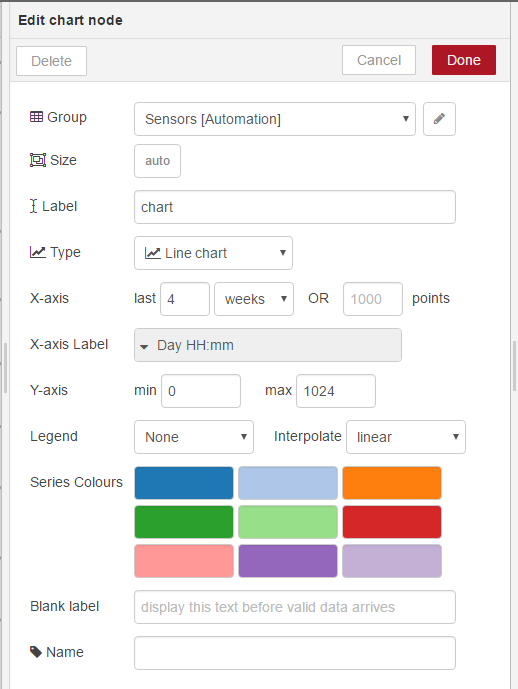
If I clear the max parameter everything works as expected. Here is chart's config:
Additional info:
- Running on RPi3
- Linux 4.9.24-v7+ (raspbian)
- node -v: v6.10.3
- NodeRed 0.16
- Dashboard v2.4
- Tested on: IE11, MS Edge 38.14393.1066.0 (EdgeHTML 14.14393), Chrome 58.0.3029.110
Recently I upgraded from 2.1.0 to 2.4.0. I have line charts with min = 0 & max = 1024. When series include values near the "Max" margin, labels on the axis get overlapped (top-left):
If I clear the max parameter everything works as expected. Here is chart's config:
Additional info: