Imagine you have just been awarded a NASA grant to investigate stellar
nucleosynthesis. Among the most important inputs into nucleosynthesis are
nuclear binding energies. The binding energy of a nucleus is the amount of
energy released when a nucleus is formed from its constituent protons and
neutrons, or conversely how much energy could be released if a nucleus were
totally disassembled. For a nucleus with
where
Although the binding energy has been measured experimentally for thousands of nuclei, an even larger number of short-lived isotopes exist whose binding energies are unknown and difficult if not impossible to measure, yet are very important to describe different nucleosynthesis processes. Of particular interest are the binding energies of heavy neutron-rich nuclei and the position of the neutron drip-line. Using the binding energy we can compute the neutron and proton separation energies which is the energy needed to separate a neutron or a proton from its nucleus; the drip-lines bound the regions with positive separation energies, that is, it takes energy to remove a proton or neutron. Beyond the drip-lines the separation energies are negative, meaning it requires no energy for a proton or neutron to just "drip off".
Fortunately, we can estimate the location of the drip-lines by using the semi-empirical mass formula:
where
The Atomic Mass Evaluation (AME) has compiled the most up to date value of all measured binding energies. You can find them in the EXPERIMENT_AME2016.dat file. The goal in this assignment is to determine the c parameters that best describe the experimental data and use those parameters to identify the position of the neutron dripline.
The best fit parameters from the linear model (like the semi-empirical mass formula above) can be determined by solving a set of linear equations, which in turn can be represented as a matrix equation.
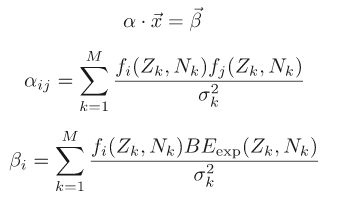
where
In this case α is a
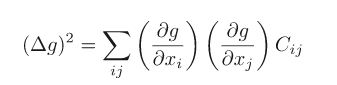
Furthermore, the inverse of the matrix corresponds to the covariance matrix
Now that we have our model we can find the neutron drip line.
The neutron drip-line is defined as the maximum values of
If you compare the experimental binding energies (the input from the data file) with the calculated binding energies, you will find that there are significant deviations, much larger than either the experimental errors or your calculated theoretical uncertainties. This is because of systematic variations not included in the semi-empirical formula, namely the existence of shells.
It would be quite beneficial to you if you had a Linux system because it would enable you to use the makefile included.
If this is the case then what you do is open a terminal, use the cd command to change to this directory.
Then type make.
You'll see some gfortran commands being executed. All of this has created an exectuable file called nuclear_energies.
In order to run this executable you type ./nuclear_energies. Make sure not to put any spaces!
Now when you run this executable it'll ask you for the name of the file. The most up to date file is EXPERIMENT_AME2016.dat and is included in the src directory.
Technically you can enter any file that exists but the program expects certain data to be there that is present in the EXPERIMENT_AME2016.dat file.
Enter that file name when it asks and if you entered it correctly then you should see results written to results.dat and results_advanced.dat.
Open up the jupyter notebook file to analyze the results.