
Sprocket Central Pty Ltd is a medium-size bikes & cycling accessories organization needs help with its customer and transactions data. The organization has a large dataset relating to its customers, but they are unsure how to effectively it to help optimize its marketing strategy.

Sprocket Central Pty Ltd has given a new list of 1000 potential customers with their demographics and attributes. However, these customers do not have prior transaction history with the organization. The marketing team at Sprocket Central Pty Ltd is unsure that, if correctly analyzed, the data would reveal useful customer insights which could help optimize resource allocation for targeted marketing. Hence, improve performance by focusing on high value customers.
Using the existing datasets (Customer demographic, customer address and transaction) as a labelled dataset, please recommend which of these 1000 new customers should be targeted to drive the most value for the organization. In building this recommendation, outline a detailed approach for completing the analysis including: understanding the data distribution, feature engineering, data transformations, model development, and result interpretation.
This project was done using Microsoft Excel. To achieve my objectives, the following task was done:
The datasets were provided by Sprocket Central Pty Ltd, and it contains four tables which are "CustomerDemographic", "CustomerAddress", "Transactions" and "NewCustomerList".
A data framework was used to identify all data quality issues from the datasets provided. The table below shows some data quality issues that I discovered during my assessment of the three datasets. The column header was used to fill in the data framework in relation to each datasset. I have also made some recommendation to improve the quality of the dataset for better analysis and good business decision-making.
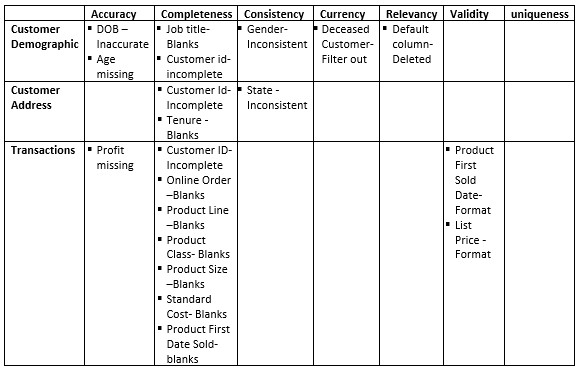
The descriptions of data quality issues discovered, and the methods of mitigation used are briefly discussed below. In addition, recommendation and explanations are included to avoid further data quality issues in the future.
- Data Accuracy
- DOB was inaccurate for Customer Demographic, age column missing and profit column missing for Transactions.
- Mitigation: filter out outlier in DOB.
- Recommendation: Create an age column to be able to check for errors. Create profit column in Transaction for accuracy of sales and it will assist in future monetary analysis.
- Data Completeness
- Customer ID were inconsistent among Customer Demographic, Transaction and Customer Address.
- Mitigation: Filter all customer ids from 1 – 3500. Filter out blank cells.
- Recommendation: Customer ids from 1 to 3500 will be used for our data model as they contain complete data. Ensure complete data and double check data across all spreadsheets. Blanks are treated as incomplete data. Hence, they are removed to avoid skewing our analysis result.
- Data Consistency
- Inconsistency in gender for Customer Demographic and Customer Address. Inconsistency in State for Customer Address.
- Mitigation: Filter all ‘M’ to Male and all ‘F and Female’ to Female for Gender. Filter New South Wales to NSW and Victoria to VIC for State.
- Recommendation: Create a dropdown option for state abbreviation. Create a dropdown option for gender.
- Data Currency
- The ‘Y’ in the Deceased column on Customer Demographic table indicate that the customer is dead.
- Mitigation: Filter out ‘Y’ in Deceased Indicator.
- Recommendation: Deceased customers are not current customer, removing them will increase the efficiency and currency of the data and will improve the accuracy of our analysis.
- Data Relevancy
- The Default column on Customer Demographic table is irrelevant.
- Mitigation: Default column deleted.
- Recommendation: Check and double check for irrelevant and incomprehensible data to be deleted or removed.
- Data Validity
- Format List price and Product first sold date in Transaction.
- Mitigation: Format (Data type) List_Price to currency and Product_first_sold_date to short date.
- Recommendation: Set up columns so that format or data types such as price or date are already in place when entering data.
The above summary are the data quality issues discovered, mitigations and recommendations. Taking all these into account will improve the quality our data and increase the efficiency of our analysis for good business decision-making.
This Model was developed using RFM Analysis. This analysis is a marketing technique used to quantitatively rank and group customers based on the recency, frequency, and monetary value of their transactions. This is used to identify the best customers and perform targeted marketing campaigns.
This analysis is used to evaluate customer behavior and identify different customer segments. It measures how recently a customer has interacted with a business. To combine the three datasets, I had to find a relationship that exist between the datasets. The customer_Id was used as a primary key since it’s a unique identifier.
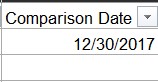
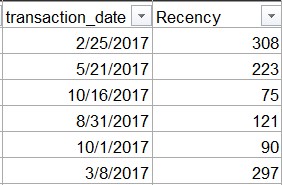
To get our Recency, I had to create a column for comparison date by sorting the transaction date from the newest to the oldest, thereby showing the last purchase date. This date was used as the comparison date.
To know how recent each customer made a purchase, I subtracted the comparison date column from the transaction date column. This gives us our recency value.
To segment and analyze customers based on their purchasing behavior. I created a pivot table from the transaction table, using the customer_id, product_id, recency(min), and profit (sum).
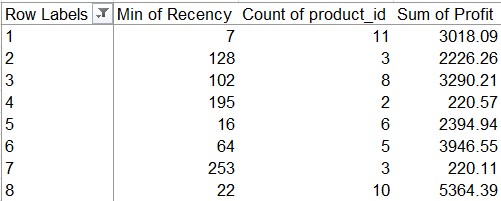
A separate table was created for Recency to calculate for Min, Lower Quartile, Median, Upper Quartile, and Max’ respectively using the QUARTILE.INC function alongside the recency column from the pivot table. This process was done for Frequency using the product_id column and Monetary using the profit column.

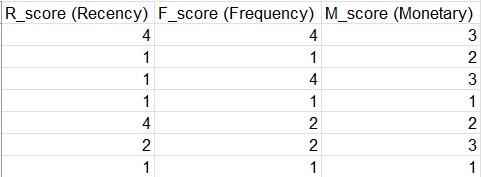
To get our R_score, F_score, and M_score, I used an IFS statement in reference to the above table earlier created. R_score: =IFS(C4>85,1,AND(C4<=85,C4>44),2,AND(C4<=44,C4>17),3,C4<=17,4) F_score: =IFS(D4>7,4,AND(D4<=7,D4>6),3,AND(D4<=6,D4>4),2,D4<=4,1) M_score: =IFS(E4>4123.1,4,AND(E4<=4123.1,E4>2799.26),3,AND(E4<=2799.26,E4>1797.95),2,E4<=1797.95,1)
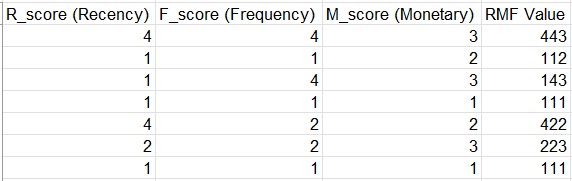
Getting the RFM value, I calculated these columns together using this formula: =100 * R_score + 10 * F_score + M_score
I also created a separate table for RFM Value to calculate for Min, Lower Quartile, Median, Higher Quartile, and Max respectively using the RFM value column.

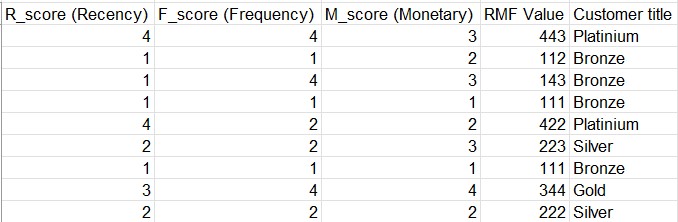
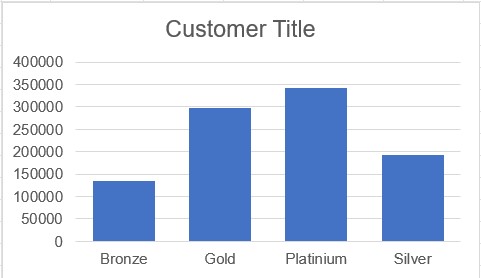
To better understand our customers with value, I created a customer title column using an IFS statement in reference to RFM Value to categorize the customers as ‘Platinum, Gold, Silver and Bronze. =IFS(I4>411,"Platinium",AND(I4<=411,I4>311),"Gold",AND(I4<=311,I4>211),"Silver",I4<=211,"Bronze")
After successfully categorizing our customer title based on our RFM values, I had to create a pivot table to visualize the analysis to draw meaning insights from it. The analysis shows that the high valued customers are those within the range of 250,000 – 350,000. These are the customers with Platinum and Gold titles.
To further determine customer wealth segment that generate high revenue which Sprocket company should focus on, I had to achieve this result by using the customer title from the RFM analysis to generate the wealth segment that has the highest profit.
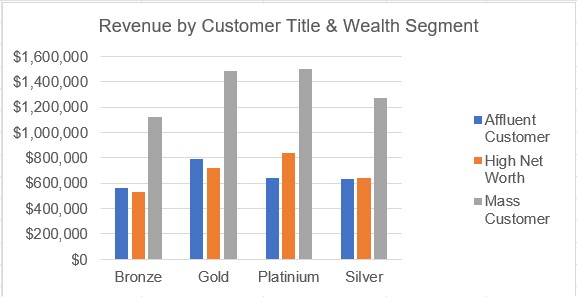
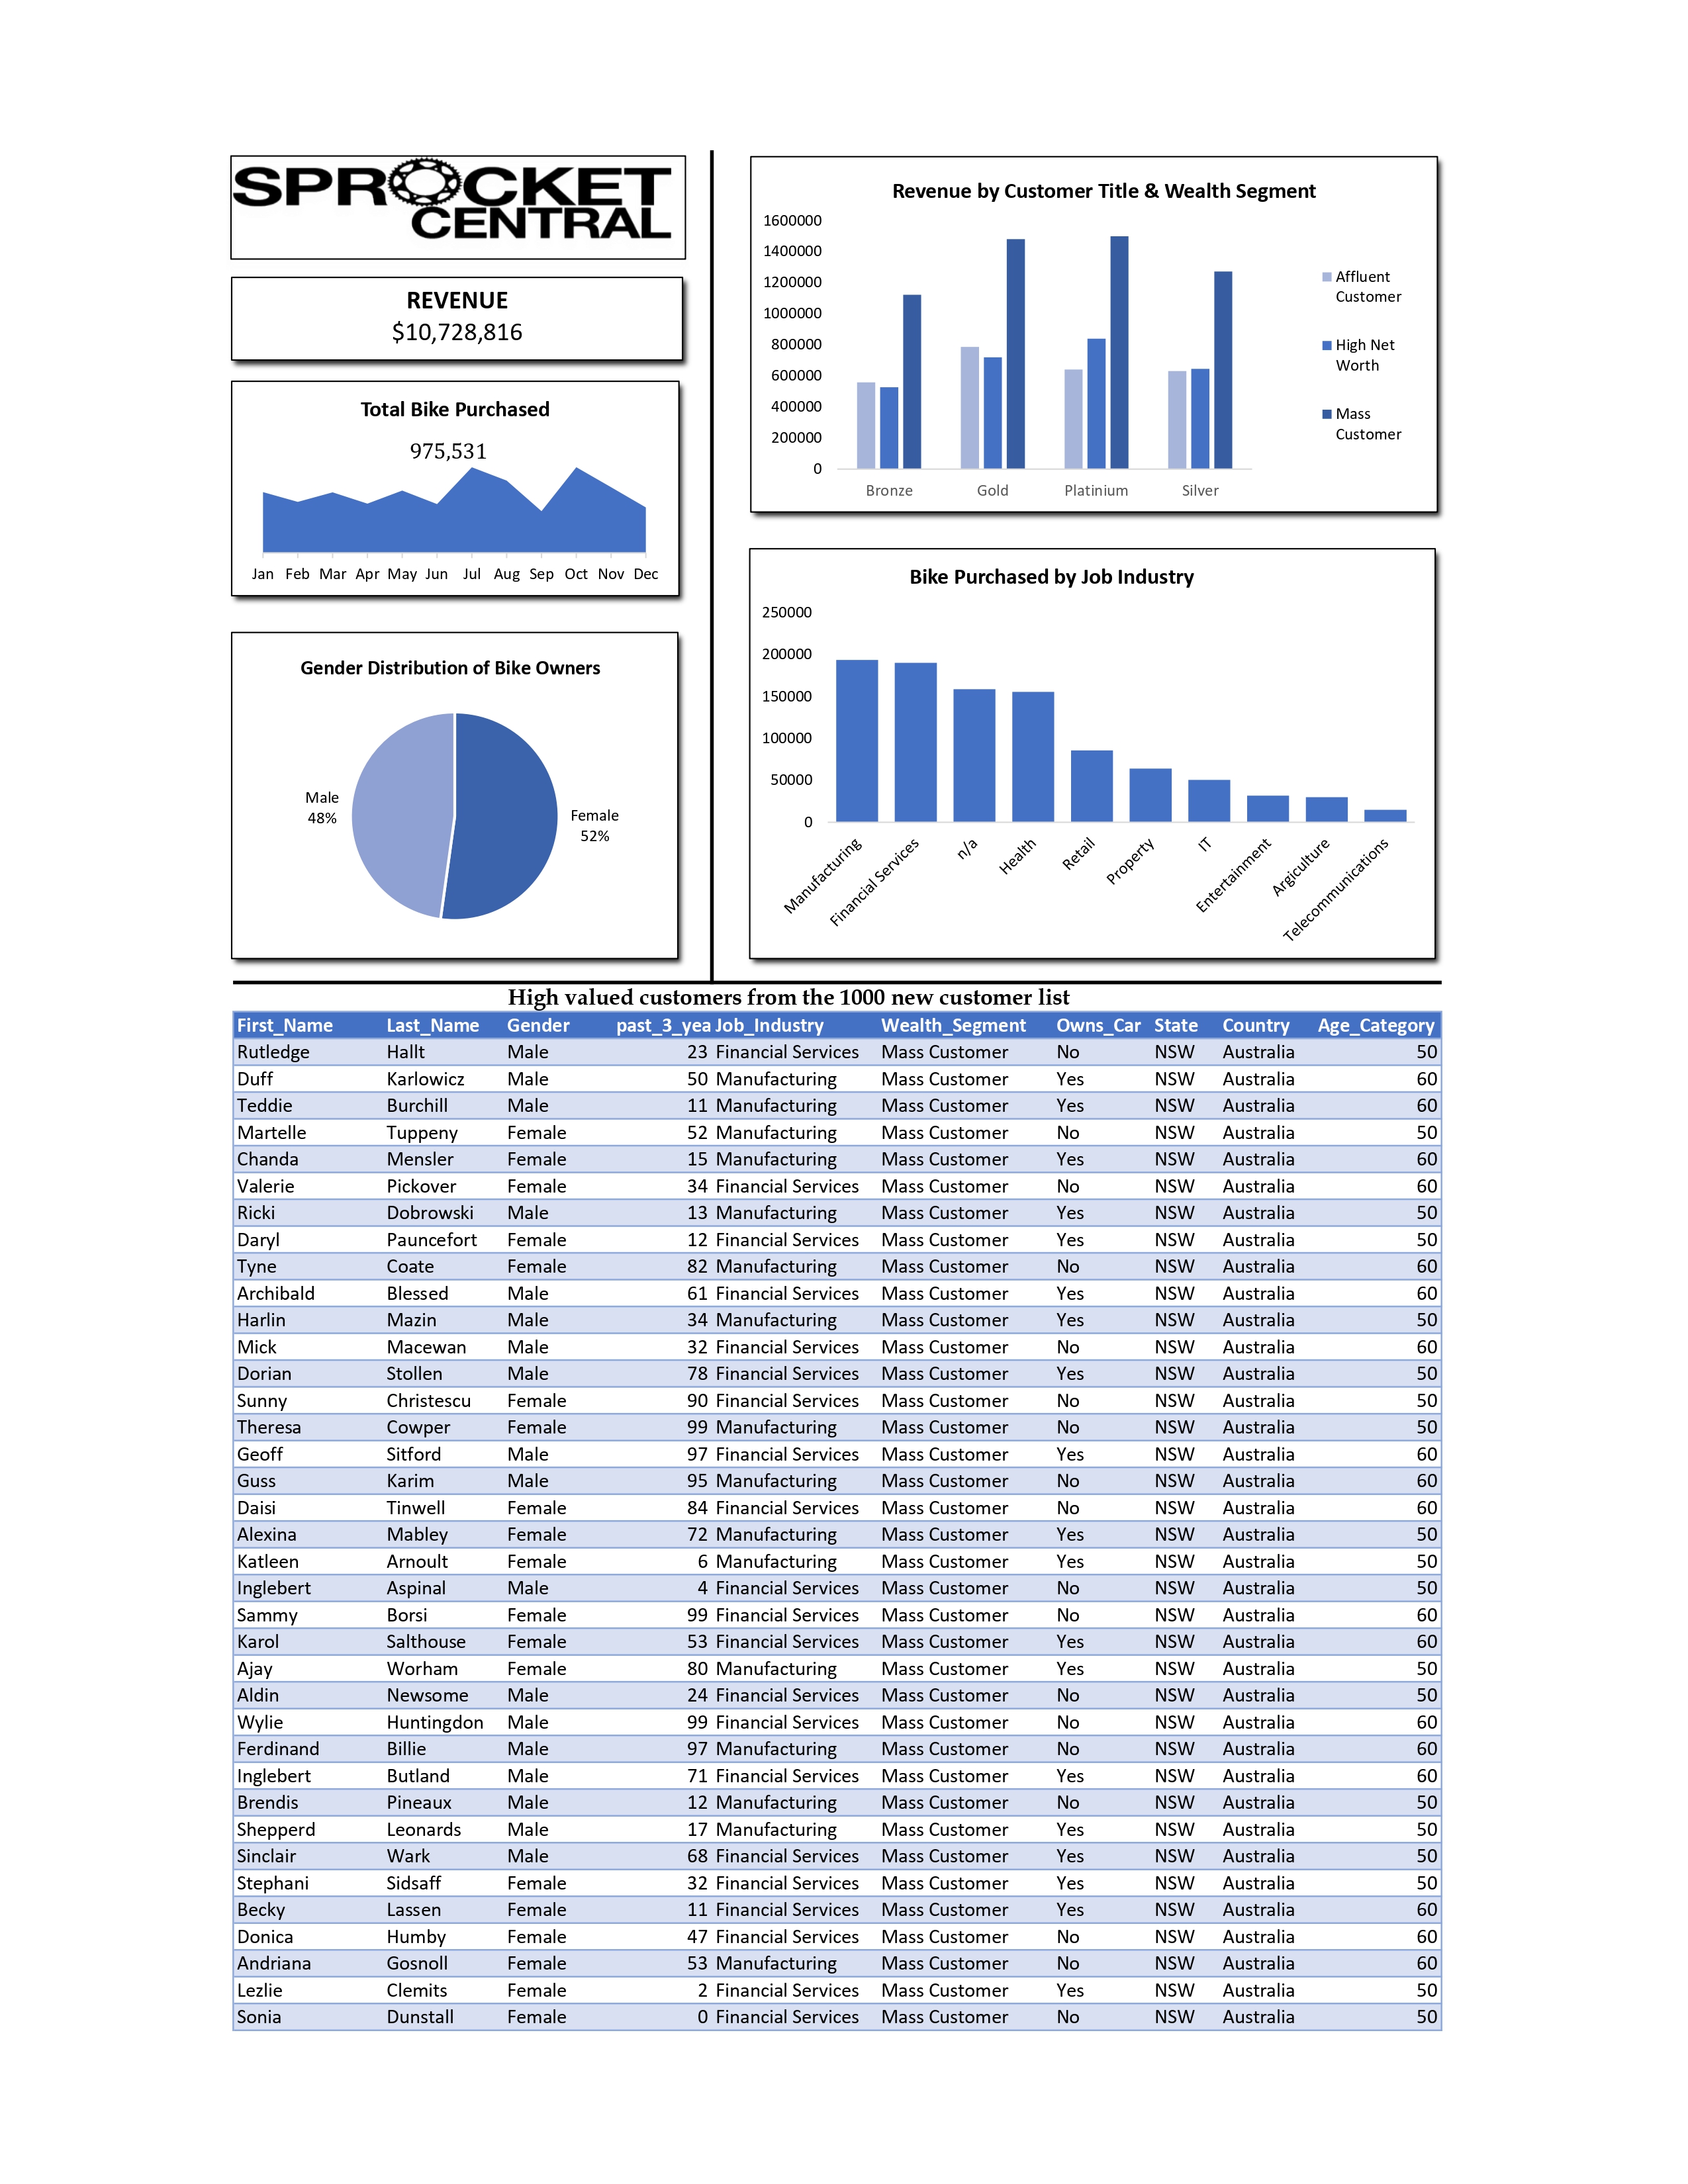
The above chart shows that the ‘mass customer’ of the wealth segment has the highest revenue across all the customer titles with over $1 million in profit. This set of customers (mass customers) can be the focus for Sprocket Ltd when considering high valued customers. The result of my analysis showed the number of bikers purchase in the last three years by the different job industry. The chart shows that manufacturing and financial services were the top industries the customers who purchased bikes belongs to.
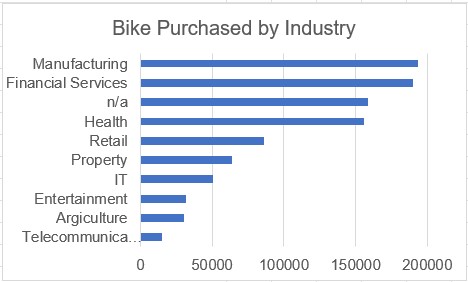
The new customer list consists of 1000 customers from which I’m to help Sprocket Ltd identify customers who will help drive value to the organization. The following was considered in targeting the right customers. The ‘mass customers, from the wealth, the age category, the bike purchased by job industry (manufacturing and financial services were the highest) and the state (NSW- New South Wales). The table below shows the customers Sprockets Ltd should target to drive value to the organization.

At the end of my analysis. I successfully identified the high-value customers from the new customer list provided by Sprocket Ltd. The RFM analysis also revealed how customer targeting can be based on factors such as purchase frequency, recency, and monetary value. By analyzing and combining these three dimensions, businesses can create customer segments that can help identify different groups with varying levels of engagement, loyalty, and profitability. These segments can then be used to tailor marketing strategies, personalize communication, allocate resources effectively, and engage customers based on their purchasing behavior.
Thank you for reading. I hope you find it very insightful.
You can reach out to me via twitter @pinnacle_paul and linkedIn @Paul Aderounmu