3d plot with date time as axis doesn't work correctly #1813
Description
Hi, I need to do a 3d scatter plot.
This is a screenshot of the plot:
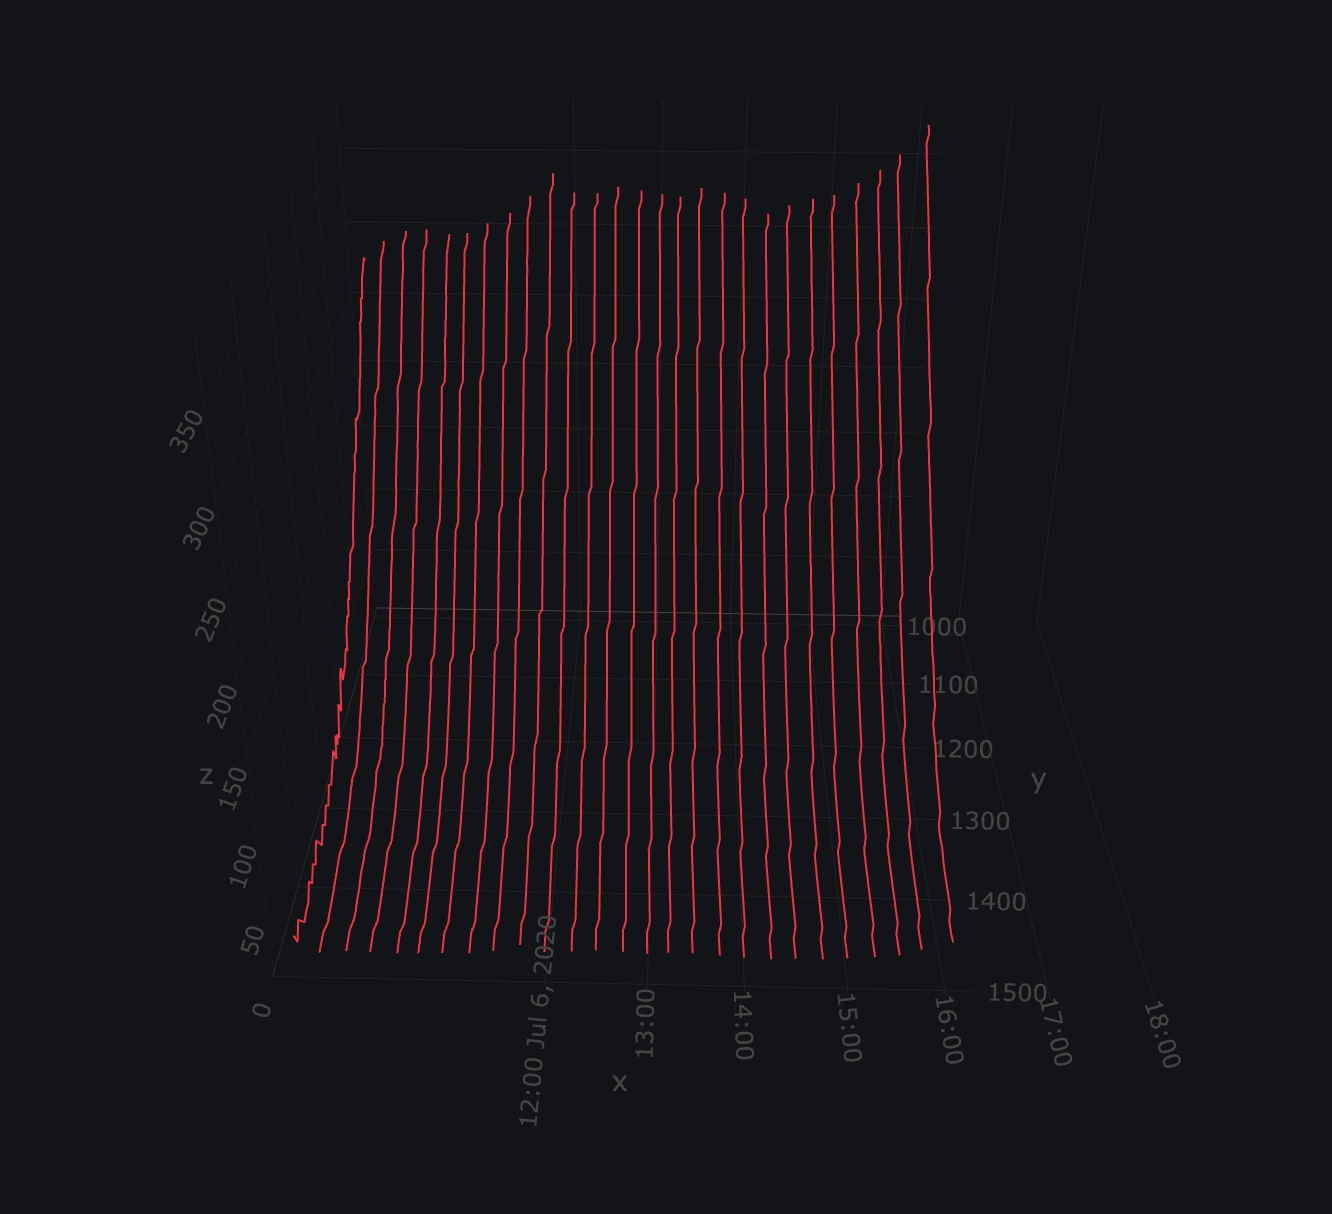
As you can see the xaxis with the date time is not correctly displayed. If I move the plot around it shows a strange 'shaky' behavior and the lines somehow are displayed 'zigzag like'.
The second screenshot is basically the same. I just used dense_rank() on the date time column and then displayed the resulting order. This leads to a correct plot.

Is there a fix/ solution for the first plot i.e. that it looks like the second plot but displays the date times instead of the dense_rank() order as xaxis?
Thank you very much.
Code first plot:
p1 <- plot_ly( df_sub, x=~datetime, y=~y, z=~z, color = ~color, colors = col )
Code second plot:
p1 <- plot_ly( df_sub, x=~order, y=~y, z=~z, color = ~color, colors = col )
Layout for both plots:
p1 %>% layout( scene=list( camera = list(eye = list(x = -2.5, y = 0, z = 0)), xaxis = list(title = "x"), yaxis = list(title = "y", autorange = "reversed"), zaxis = list(title = "z"), aspectratio = list(x = 1.2, y = 1.2, z = 1.2)), paper_bgcolor='rgb(19,20,23)', uirevision=T, showlegend=T ) %>% group_by(group_var) %>% add_lines