Histogram display ranges on x-axis. #5893
Description
Hi,
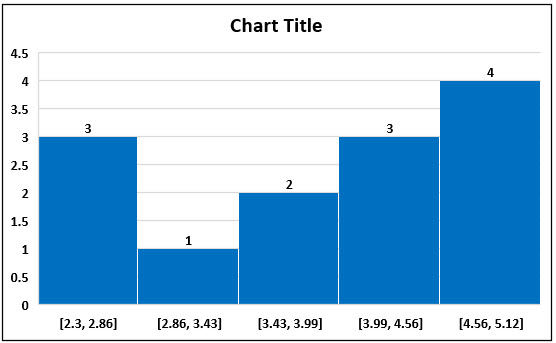
I'm creating a histogram using the nbinx property to set the number of bins. Instead of displaying the ranges when I hover a specific bar, I would like to display them on the x-axis, like this:
Thanks!