Scatter plot with date x-axis and dateTime2ms performance #6417
Description
Hello,
Thank you for all your efforts in providing such an amazing graphing library.
We have been using this library in a project which includes a lot of scatter/scattergl plots with realtime data with date axis. The data for plotting comes from 3 - 6 same sensors with a sampling rate of 120 Hz. We update the plot every 100-ms (for real time effect). The x-axis date/time is calculated based on number of samples for each sensor and sampling rate i.e. 120 Hz.
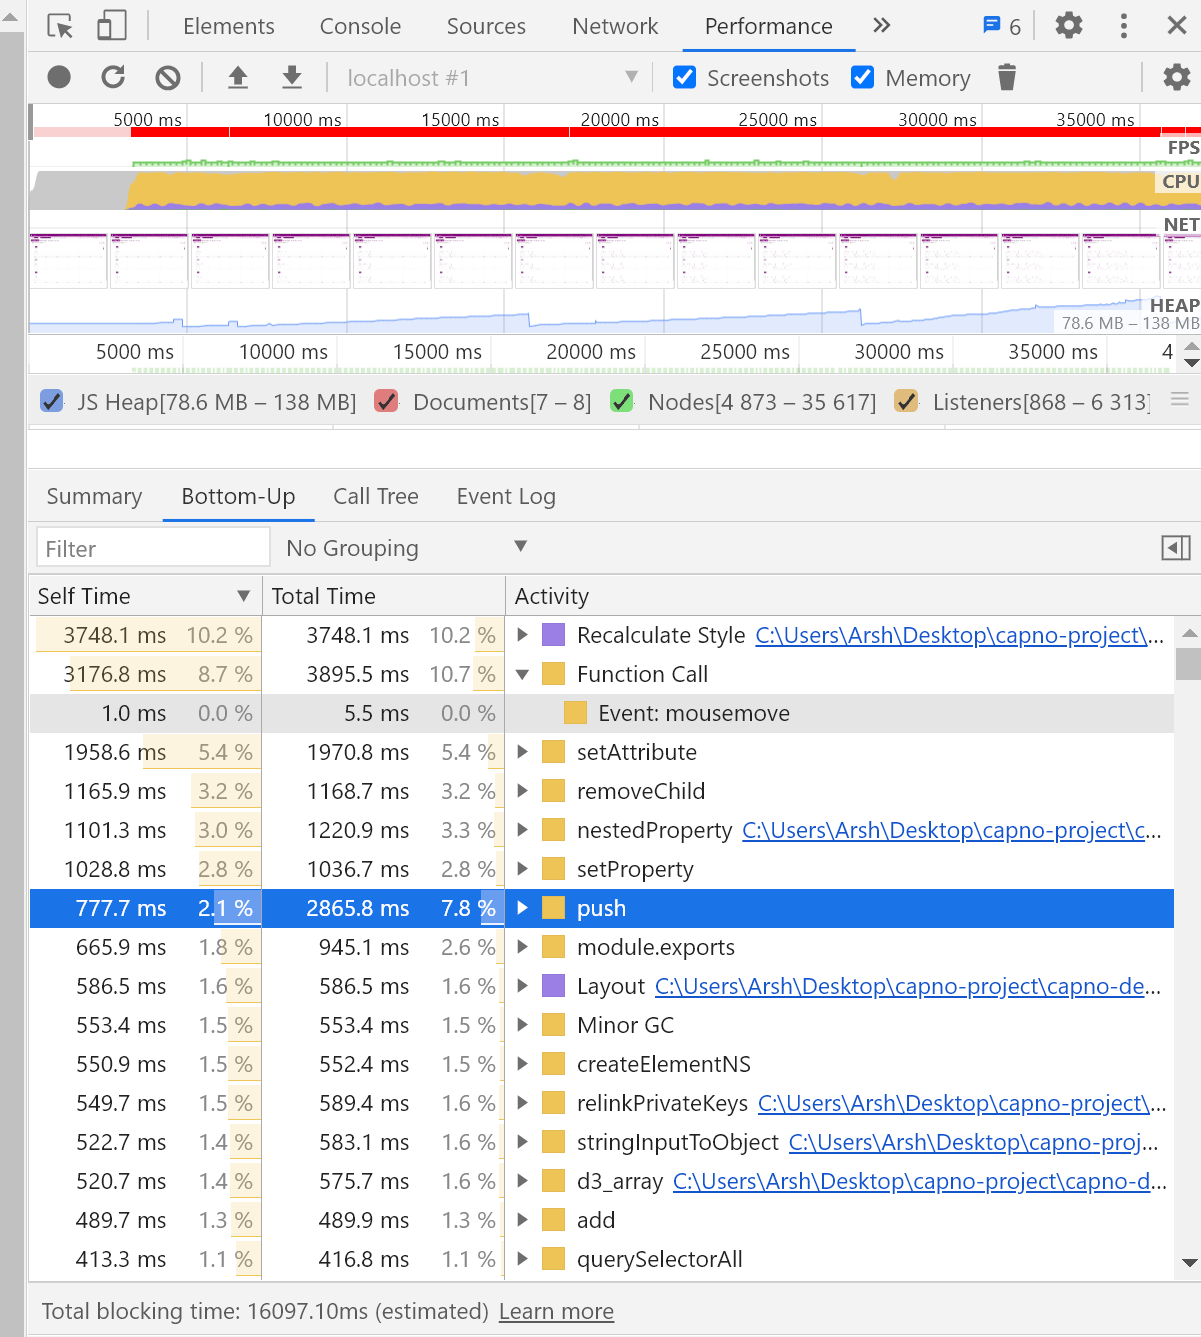
Recently on doing performance tests (using Chrome Developer tools), we noticed that export.dateTime2ms function is taking too long to execute (as shown in the screenshot as well as the attached profile).

As opposed to date axis, if we use the numeric axis, the performance is slightly better:
Considering we want to update the graphs every 100 ms and during those 100 ms, we need to read sensors, process data, plot them, save them in files, move x-axis, and a few other task, we want to make sure we are not doing something that takes a lot of time to execute but is not required.
Hence, my question is really about the dateTime2ms performance? Why is it taking so long to execute? is there a way around it. We can not use numeric axis. Are there any way to improve performance such as not use 'x-axis ticks' etc.
Thank you