- Create a dataframe with two columns
sample_date and analysis_date, both of type datetime64. Neither column has missing values.
- Create a scatterplot with
px.scatter(df, x="sample_date", y="analysis_date") - works fine.
- Create another scatterplot with a trendline using
px.scatter(df, x="sample_date", y="analysis_date", trendline="ols"): blows up.
The error message is:
numpy.core._exceptions._UFuncBinaryResolutionError: ufunc 'subtract' cannot use operands with types dtype('<M8[ns]') and dtype('O')
A workaround is to convert the datetime64 columns to ordinal numbers:
for colname in ("sample_date", "analysis_date"):
    df[colname] = df[colname].map(datetime.toordinal)
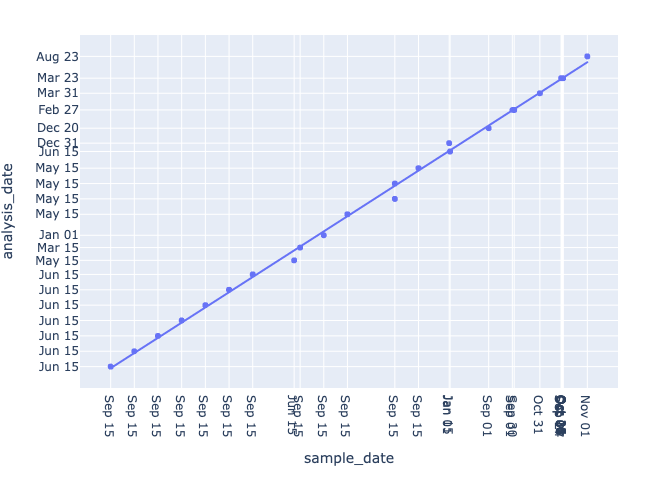
but then the ticks are wrong (large integers instead of datetimes). This can be partially corrected by specifying the ticks:
tick_x = df['sample_date'].map(lambda x: datetime.fromordinal(x).strftime('%b %d'))
fig.update_xaxes(tickvals=df['sample_date'], ticktext=tick_x)
tick_y = df['analysis_date'].map(lambda x: datetime.fromordinal(x).strftime('%b %d'))
fig.update_yaxes(tickvals=df['analysis_date'], ticktext=tick_y)
but then the spacing of ticks/lines along the axes is uneven (see screenshot).
Desired behavior: trendlines with time-series data should work out of the box.
sample_dateandanalysis_date, both of typedatetime64. Neither column has missing values.px.scatter(df, x="sample_date", y="analysis_date")- works fine.px.scatter(df, x="sample_date", y="analysis_date", trendline="ols"): blows up.The error message is:
A workaround is to convert the datetime64 columns to ordinal numbers:
but then the ticks are wrong (large integers instead of datetimes). This can be partially corrected by specifying the ticks:
but then the spacing of ticks/lines along the axes is uneven (see screenshot).
Desired behavior: trendlines with time-series data should work out of the box.