Barpolar heatmap doesn't show all values in plotly 5.13.0 #4058
Description
Hello,
I'm trying to create a polar heatmap with the days of the week as r-values and the hour of the day as theta-values.
Minimal example:
import plotly.graph_objects as go
import numpy as np
import pandas as pd
import calendar
import locale

locale.setlocale(locale.LC_TIME, locale.normalize("en_US.utf8"))

def hr2angle(hr):
    return (hr * 15) % 360

def hr_str(hr):
    return str(hr) + " Uhr"

df1 = pd.DataFrame({'weekday': list(calendar.day_name)})    # 'Monday', 'Tuesday',...,'Sunday' -> radial axis
df2 = pd.DataFrame({'hour': list(range(24))})               # 0, 1,..., 23 -> angular axis
df2['theta'] = df2['hour'] * 360 / 24 + 360 / 24 / 2        # hour to angle + 1/2 slice extra rotation

df3 = pd.merge(df1, df2, how='cross')                       # dataframe with 7x24=168 rows
df3['frequency'] = np.random.randint(0, 20, df3.shape[0])   # Add random frequencies

# print(df3)
#     weekday  hour  theta  frequency
# 0    Monday     0    7.5         17
# 1    Monday     1   22.5         15
# 2    Monday     2   37.5         11
# 3    Monday     3   52.5          4
# 4    Monday     4   67.5          2
# ..      ...   ...    ...        ...
# 163  Sunday    19  292.5          4
# 164  Sunday    20  307.5          4
# 165  Sunday    21  322.5         19
# 166  Sunday    22  337.5         17
# 167  Sunday    23  352.5          2
#
# [168 rows x 4 columns]

fig = go.Figure(go.Barpolar(r=df3['weekday'],
                            theta=df3['theta'],
                            marker_color=df3['frequency'],
                            marker_colorscale='ylgn'
                           )
)

fig.update_layout(polar_angularaxis_rotation=90,
                  polar_angularaxis_direction='clockwise',
                  polar_angularaxis_tickmode='array',
                  polar_angularaxis_tickvals=[hr2angle(hr) for hr in range(24)],
                  polar_angularaxis_ticktext=[hr_str(hr) for hr in range(24)],
                  polar_bargap=0
)

fig.show()
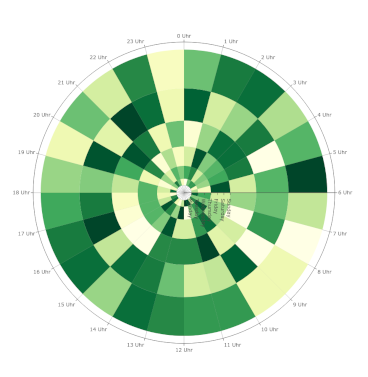
Despite of wrong placed r-axis ticks, the plot shows an empty innermost circle instead of the segment for the 'Monday'-values.
When I add e.g. 'Extraday' by replacing the line
df1 = pd.DataFrame({'weekday': list(calendar.day_name)})
with
daylist = ['Extraday']
daylist.extend(list(calendar.day_name))
df1 = pd.DataFrame({'weekday': daylist})                    # 'Extraday', 'Monday'...,'Sunday' (8 rows)
I can see the values for Monday.