Skip to content
New issue

Have a question about this project? Sign up for a free GitHub account to open an issue and contact its maintainers and the community.

By clicking “Sign up for GitHub”, you agree to our terms of service and privacy statement. We’ll occasionally send you account related emails.

Already on GitHub? Sign in to your account

Grafana default password for admin #956

Closed
ericzji opened this issue Feb 2, 2018 · 16 comments
Closed

Grafana default password for admin #956

ericzji opened this issue Feb 2, 2018 · 16 comments

Comments

@ericzji
Copy link

ericzji commented Feb 2, 2018

kube-prometheus

After run hack/cluster-monitoring/deploy
We should be able to reach Grafana on node port 30902

I am wondering what's the Grafana default password for admin user? Not able to login with admin/admin

thanks
-Eric

@elisiano
Copy link
Contributor

elisiano commented Feb 2, 2018

according to this https://github.com/coreos/prometheus-operator/blob/master/contrib/kube-prometheus/manifests/grafana/grafana-credentials.yaml it looks like it's admin/admin (the manifest has the values base64 encoded)

@ericzji
Copy link
Author

ericzji commented Feb 2, 2018

@elisiano thanks for reply. Tried admin/admin, but failed.
Any way I can get the admin password?

I can use the following command
kubectl get secret --namespace default my-release-grafana -o jsonpath="{.data.grafana-admin-password}" | base64 --decode ; echo
if I run "helm install --name my-grafana stable/grafana"

Any way I can get the admin password for this installation?
thanks

@elisiano
Copy link
Contributor

elisiano commented Feb 2, 2018

I'm not familiar with the chart installation method but if you used the deploy script without setting a NAMESPACE variable then it uses monitoring by default. Try looking up the secret in that namespace.

My experience is limited I'm not sure I can be of further help.
How are you trying to access grafana?
"it works for me" with kubectl proxy and then accessing http://127.0.0.1:8001/api/v1/namespaces/monitoring/services/http:grafana:3000/proxy/ but you could also use port-forward instead of proxy

@ericzji
Copy link
Author

ericzji commented Feb 2, 2018

@elisiano Thanks.
Same issue with port-forward

seems the password should be "admin" as per the following:
$ kubectl get secret --namespace monitoring grafana-credentials -o yaml
apiVersion: v1
data:
password: YWRtaW4=
user: YWRtaW4=

$ echo "YWRtaW4=" | base64 --decode
admin

Now, every time I login to http://127.0.0.1:30902/login, it reports the error:
Server side error :(
runtime error: index out of range
check the Grafana server logs for the detailed error message.

@elisiano
Copy link
Contributor

elisiano commented Feb 2, 2018

Are you using a non-standard port? Because with port-forward by default it's port 3000

@mike-henders
Copy link

I am encountering this problem as well. Looking at the logs it appears the directory /grafana/data does not exist and the grafana does not have permission to add it.

I worked around it by creating a new emptyDir: {} volume and mounting it to /grafana/data in the container. I don't know if this is the correct solution. I'm experiment so I can afford to lose data if I make a mistake.

@gianrubio
Copy link
Contributor

@ericzji could you past the grafana logs?

@mike-henders probably your issue is the same as #924 right?

@mike-henders
Copy link

@gianrubio Yes. My issue looks the same as #924.

@ericzji
Copy link
Author

ericzji commented Feb 5, 2018

@gianrubio I am sorry but where I can get grafana logs? don't see it from /var/log/grafana/grafana.log

BTW, I am running as a non-root user

@ericzji
Copy link
Author

ericzji commented Feb 5, 2018

prometheus-status-targets

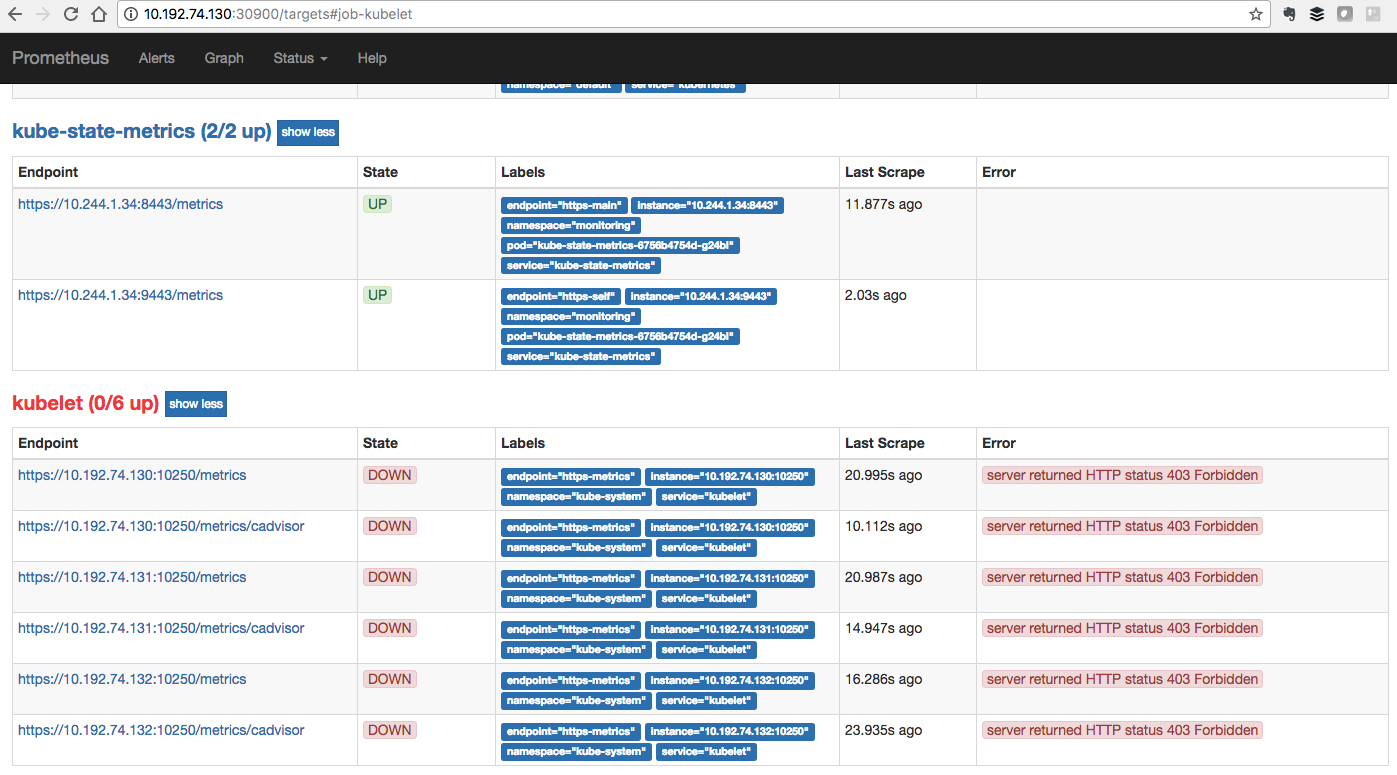
Also in my case, the kubelet are not up as shown from prometheus. (attached)

@gianrubio
Copy link
Contributor

Use kubect logs -f -n monitoring grafana-pod-name

@ScottBrenner
Copy link
Contributor

@ericzji This helped me resolve the kuebelet 403 issue you're seeing: kubernetes/kubernetes#44330 (comment)

@brancz
Copy link
Contributor

brancz commented Feb 9, 2018

Make sure your clusters actually follow the requirements on kubelet authorization and authentication. https://github.com/coreos/prometheus-operator/tree/master/contrib/kube-prometheus#prerequisites

@brancz
Copy link
Contributor

brancz commented Apr 12, 2018

As there doesn’t seem to be an issue with the Prometheus operator here I’m closing this.

@gadelkareem
Copy link

gadelkareem commented Jan 9, 2020

Now it is

kubectl get secret grafana -o jsonpath="{.data.admin-password}" | base64 --decode ; echo

@metalmatze
Copy link
Member

At most this is related to kube-prometheus and not the Prometheus Operator. I'm locking this conversation going forward.

@prometheus-operator prometheus-operator locked as off-topic and limited conversation to collaborators Jan 9, 2020
Sign up for free to subscribe to this conversation on GitHub. Already have an account? Sign in.
Labels
None yet
Projects
None yet
Development

No branches or pull requests

8 participants