Bioconductor:
Archive:
Linux/macOS:
Win:
Tests:
Article [PDF]
Stempor P and Ahringer J. SeqPlots - Interactive software for exploratory data analyses, pattern discovery and visualization in genomics [version 1; referees: 2 approved, 1 approved with reservations]. Wellcome Open Res 2016, 1:14 doi: 10.12688/wellcomeopenres.10004.1
❗ RELEASE NOTE ❗
GitHub repository holds development version of SeqPlots. The release is available on Bioconductor. Please report the problem, bugs, unexpected behaviors and missing features using issue tracker.
The working demonstration preview of SeqPlots is available on ShinyApps.io: https://seqplots.shinyapps.io/seqplots/
Demo limits:
- the application contains some pre-loaded data (C. elegans genes and histone modifications)
- size of uploaded files is limited to 30MB, please bin or subset your tracks to fit within the limit (due to ShinyApps beta upload limitations)
- only C. elegans genome is available (due ShinyApps beta space limits)
- uploaded files will be deleted after some time
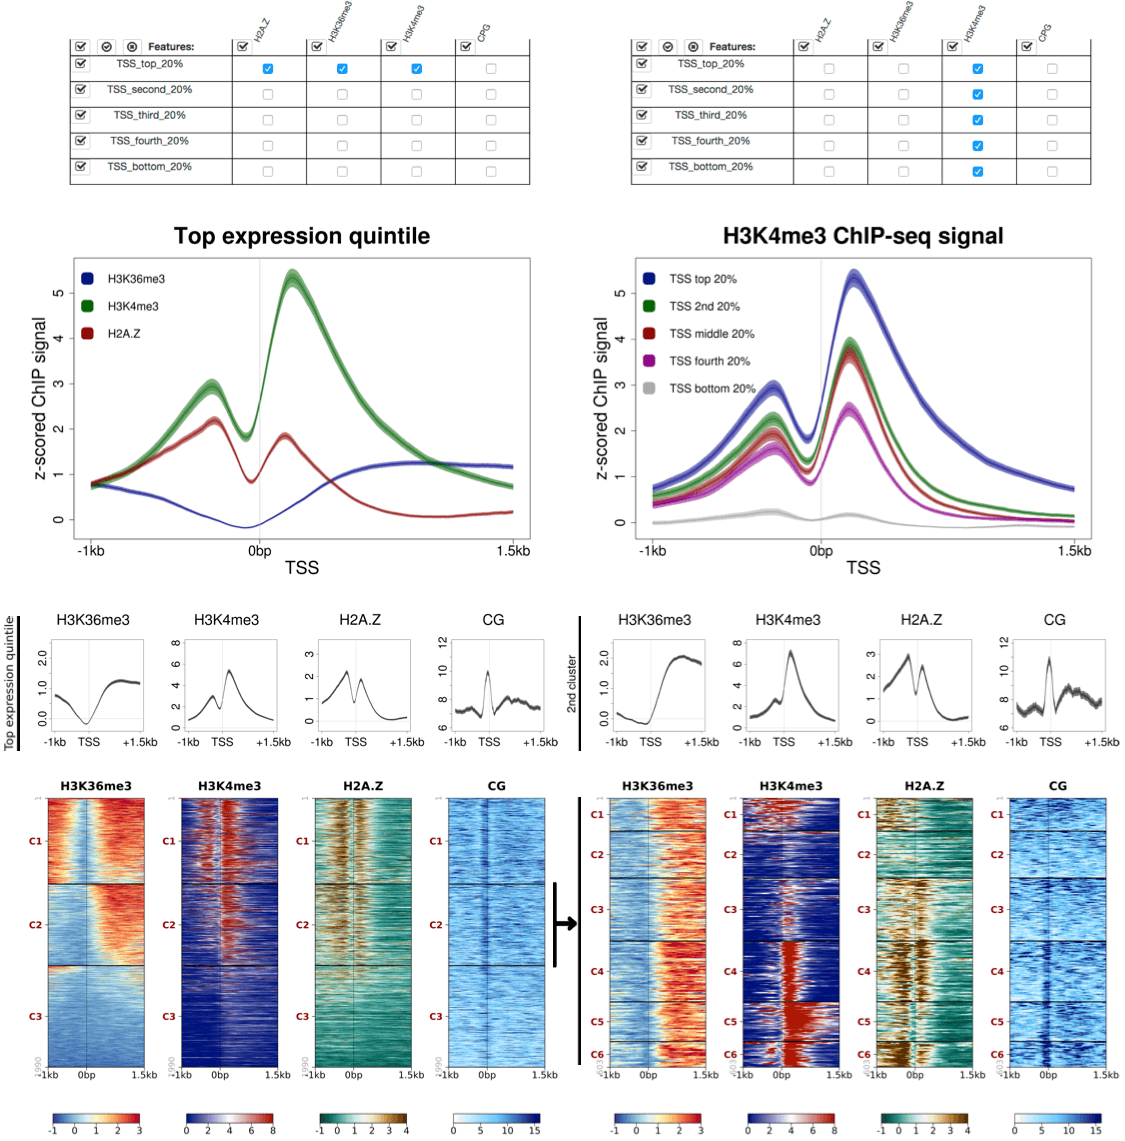
SeqPlots is a user-friendly exploratory data analysis (EDA) and visualization software for genomics. After choosing groups of signal and feature files and defining plotting parameters, users can generate profile plots of average signal or heat maps clustered using different algorithms in a matter of seconds through the graphical user interface (GUI) controls. SeqPlots accepts all major genomic file formats as input and can also generate and plot user defined motif densities. Profile plots and heatmaps are highly configurable and batch operations can be used to generate a large number of plots at once. SeqPlots is available as a GUI application for Mac or Windows and Linux, or as an R/Bioconductor package. It can also be deployed on a server for remote and collaborative usage. The analysis features and ease of use of SeqPlots encourages wide data exploration, which should aid the discovery of novel genomic associations.
Install develpment version from Bioconductor:
if (!requireNamespace("BiocManager", quietly=TRUE))
    install.packages("BiocManager")
BiocManager::install("seqplots")
To install GitHub vesrion (in order to solve dependencies install from Bioconductor first):
if (!require("devtools")) install.packages("devtools")
devtools::install_github('przemol/seqplots', build_vignettes=FALSE)
To start web browser GUI:
library(seqplots)
run()
To start with R scripting mode:
?getPlotSetArry
The App bundle is an easy way to use SeqPlots for macOS, Win and Linux. It contains all R binaries and packages that SeqPlots depends on. Additionally, test tracks and genome annotations, and reference sequences for Drosophila melanogaster and Caenorhabditis elegans are included. Sequences for other organisms can be downloaded using a graphical user interface - follow the instructions here: http://przemol.github.io/seqplots/#genomes-managment
- Mac OS X 10.9 (Mavericks) or higher
- Windows 7 or higher (64bit)
- Ubuntu 16.04 (possibly other distributions, not tested)
https://github.com/Przemol/seqplots_electron/releases/latest
R project and Bioconductor
- R Core Team (2014). R: A language and environment for statistical computing. R Foundation for Statistical Computing, Vienna, Austria. URL http://www.R-project.org/.
- Bioconductor: Open software development for computational biology and bioinformatics R. Gentleman, V. J. Carey, D. M. Bates, B.Bolstad, M.Dettling, S. Dudoit, B. Ellis, L. Gautier, Y. Ge, and others 2004, Genome Biology, Vol. 5, R80. URL http://www.bioconductor.org/.
- RStudio and Inc. (2014). shiny: Web Application Framework for R. R package version 0.10.1. http://shiny.rstudio.com/
- Other CRAN packages: digest, DBI,RSQLite, RJSONIO, plotrix, fields, grid, kohonen, Cairo and parallel
- Bioconductor packages: IRanges, BSgenome, Rsamtools, rtracklayer, GenomicRanges and Biostrings
JavaScript and CSS
- jQuery framework - http://jquery.com
- Bootstrap - http://getbootstrap.com
- DataTables, Table plug-in for jQuery - http://www.datatables.net
- jQuery File Upload Plugin - https://github.com/blueimp/jQuery-File-Upload
- jQuery throttle - http://benalman.com/projects/jquery-throttle-debounce-plugin/
- jQuery Cookie Plugin - https://github.com/carhartl/jquery-cookie
- Modernizer JS library - http://modernizr.com
- JavaScript Templates - https://github.com/blueimp/JavaScript-Templates
- JavaScript Color Picker - http://jscolor.com
- md5-js - https://github.com/wbond/md5-js
- Font Awesome - http://fortawesome.github.io/Font-Awesome
- Google Fonts - https://www.google.com/fonts
- jQuery user interface - http://jqueryui.com (documentation)
- jquery.tocify.js: jQuery Table of Contents - https://github.com/gfranko/jquery.tocify.js (documentation)
- Strapdown https://github.com/arturadib/strapdown (documentation)
- Bootswatch themes - http://bootswatch.com (documentation)
- google-code-prettify - https://code.google.com/p/google-code-prettify (documentation)
- marked - https://github.com/chjj/marked (documentation)
Important conceptual contribution to the project
- Liu T, Ortiz J, Taing L, Meyer C, Lee B, Zhang Y, Shin H, Wong S, Ma J, Lei Y, et al. 2011. Cistrome: an integrative platform for transcriptional regulation studies. Genome Biology 12: R83.
- Thomas Williams, Colin Kelley and others (2010). Gnuplot 4.4: an interactive plotting program. URL http://www.R-project.org/.
- Kent, W.J., Sugnet, C.W., Furey, T.S., Roskin, K.M., Pringle, T.H., Zahler, A.M. and Haussler, a. D. (2002). The Human Genome Browser at UCSC. Genome Research. 12:996–1006.
- Kent WJ, Zweig AS, Barber G, Hinrichs AS, Karolchik D. (2010). BigWig and BigBed: enabling browsing of large distributed datasets. Bioinformatics. 1;26(17):2204-7
- Nicol, J.W., Helt, G.A., Blanchard, S.G., Raja, A. and Loraine, A.E. (2009). The Integrated Genome Browser: free software for distribution and exploration of genome-scale datasets. Bioinformatics (Oxford, England). 25:2730–1.
- Thorvaldsdóttir, H., Robinson, J.T. and Mesirov, J.P. (2012). Integrative Genomics Viewer (IGV): high-performance genomics data visualization and exploration. Briefings in bioinformatics. bbs017
Server deployment
- Shiny Server - https://github.com/rstudio/shiny-server
- ShinyApps - https://github.com/rstudio/shinyapps
Publications containing figures made by SeqPlots
- Chen RA, Stempor P, Down TA, Zeiser E, Feuer SK, Ahringer J. Extreme HOT regions are CpG-dense promoters in C. elegans and humans. Genome Res 24(7):1138-1146 Jul 2014
- Latorre I, Chesney MA, Garrigues JM, Stempor P et al. The DREAM complex promotes gene body H2A.Z for target repression. Genes Dev 2015 Mar 1;29(5):495-500.

