Poor spillback scheduling behavior in large clusters #10150
Comments
|
Interesting. @mattearllongshot to clarify, does this happen also on a fixed-sized (non-autoscaling cluster)? I can't think of any reason why this would happen, beyond some scheduling bug (cc @stephanie-wang for ideas) |
|
It seems likely due to bad behavior in the spillback policy used to load-balance tasks in a cluster. Could also just be that the spillback policy is too slow to push tasks onto other nodes. @wuisawesome probably has a better idea than me. |
|
Ah, this might just be fixed in the new scheduler (or at least, it makes sense to investigate after we've enabled the new scheduler). |
|
@mattearllongshot you mentioned errors/warnings. are these just warning about the number of workers started? or are there other warnings? My initial instinct was that this could be a side effect of rate limiting the number of in flight lease requests? If Stephanie's theory is correct, this should go away/change with the new scheduler. I agree that we should investigate after/when enabling the new scheduler. |
|
Hi @wuisawesome, I've pasted the errors here https://github.com/ray-project/ray/files/5083237/errors.txt . They look like raylet crashes. Both of the IPs shown in the log are for worker nodes. Is the new scheduler in the nightlies? I've just reproduced the issue with the latest ray nightly build (latest as of Monday, at least). Here is the output from that run: |
|
I've just managed to reproduce something similar locally (with yesterday's nightly). output: so start times are staggered by up to 6 seconds, when launching 30 sleep tasks. Could this be related to the main issue above? No raylet crashes this time though. |
|
That's probably just worker start delay, it takes time to launch 50
workers. Subsequent runs will be faster.
…On Tue, Aug 18, 2020, 3:13 AM mattearllongshot ***@***.***> wrote:
I've just managed to reproduce something similar locally (with yesterday's
nightly).
import datetime, time, ray

ray.init(num_cpus=50)

@ray.remote(num_cpus=1)
def func():
    start = datetime.datetime.utcnow()
    time.sleep(15)
    return start

results = ray.get([func.remote() for _ in range(30)])
min_time = min(results)
print([(r - min_time).total_seconds() for r in results])
output:
[0.002964, 0.002317, 0.021966, 0.0, 0.001448, 0.034085, 0.003278,
0.004434, 0.004678, 0.00506, 0.005454, 0.006248, 0.344598, 0.682394,
1.028834, 1.362036, 1.698101, 2.02707, 2.370679, 2.71421, 3.103086,
3.429623, 3.792918, 4.165995, 4.483482, 4.817203, 5.157538, 5.475349,
5.825019, 6.172419]
so start times are staggered by up to 6 seconds, when launching 30 sleep
tasks. Could this be related to the main issue above?
—
You are receiving this because you commented.
Reply to this email directly, view it on GitHub
<#10150 (comment)>,
or unsubscribe
<https://github.com/notifications/unsubscribe-auth/AAADUSRJP2YHH4YEMR6KGL3SBJH4VANCNFSM4QBNQ3PQ>
.
|
|
Hmm yeah 300ms is long, but we never really optimize for start up time so it's definitely believable. I will label this an enhancement because we could probably do a better job of tuning some of our constants (in this case, maybe |
|
Hmm @wuisawesome, is that relevant to the original issue, though? It doesn't seem like worker startup time alone explains the staggered tasks in the cluster version. Anyway, it'd be good to confirm if that's the case. |
|
So the 2 "non-bug" factors here are autoscaling latency and overhead of spinning up new workers. We should probably confirm both of those, and see what portion of the staggering this accounts for (it sounds like your intuition is saying it won't account for all of this?) |
|
I don't think autoscaling latency is relevant here since the diagram shows that all machines start at around the same time. The reason I don't think the worker startup time is the only issue is because the diagram shows that times are staggered by up to ~60s. c4.8xlarge as 36 vCPUs, so that would mean nearly 2s to start each worker process, which seems very high. |
|
Btw, I heard issues in the past that the worker startup took more than a couple seconds when it is running inside containers. Don't remember the details though. (#9221) |
|
Ok, it sounds like the local issue is indeed separate then. I don't think it's #9221 since we're not using docker or containers. Is there any more info I can grab to help diagnose the cluster issue? |
|
One other feature in the diagram is that some nodes start just fine (all workers start instantaneously) which makes me doubt that it's just a performance barrier on worker startup time, otherwise why would some nodes be immune to it? |
|
Here's the output of |
|
One thing that might help is if you could collect the raylet logs from all of the nodes with debug logging on. This is a bit of a headache to do, so only if you're stuck on this :)
|
|
Here's the output for one of worker node's raylets: I have the others so if you need any more, let me know (in total they are 150MB compressed). |
|
Note that the performance this time was slightly worse than before (the spread of the start times of each task was even longer), possibly due to the extra work that was having to be done by the logging? |
|
Ack yeah, so this seems to be very clearly an issue with the current spillback scheduling policy (the policy used to distribute tasks across multiple nodes). In this file alone, there are 2000+ events where the raylet spills back to another node! :( Sorry this is so bad right now, but hopefully the new scheduler will make these issues go away. @wuisawesome could potentially work on a quick fix for the current scheduler that would at least solve this issue. @mattearllongshot, are you blocked on this right now? |
|
Hi @stephanie-wang we're not really blocked, but it'd be nice to get it fixed since it's adding a couple of minutes onto our testing times, plus the associated EC2 charges. You mention it should be fixed in the new scheduler, is the new scheduler in the latest nightlies? The above testing was done with the nightly build as of Monday. |
|
@stephanie-wang I think we've discovered this in the stress test before (when there are lots of stress, there are lots of spillback). The root cause was inbetween each heartbeat update, the node has wrong information, and it spillbacks to the wrong nodes. I think if we materialize heartbeat data (meaning we temporarily update the heartbeat data in-memory), this can be alleviated. |
Thanks, @rkooo567! But unfortunately I don't think that's the problem here. There are as many cores as tasks so any of the nodes are feasible and there shouldn't really be a stale heartbeat problem, except maybe when a node is close to becoming full.
@wuisawesome can comment on this. |
|
@mattearllongshot the new scheduler isn't really ready to be used yet. It will likely be usable (but not stable or on by default) in ~1 month. Essentially long enough to not be useful for you, but close enough that there probably won't be any major overhauls to the current scheduler. Definitely open to a quick heuristic to help with spillback on the current scheduler though. |
|
Thanks for the updates everyone. Looking forward to trying out the new scheduler when it's ready. In the meantime are there any settings we can tweak with the current scheduler to minimize this effect, or are there any possible workarounds? |
|
Hmm I don't think we fully understand the scope of this bug yet which makes it hard to suggest a mitigation. If you could use actors instead of tasks, that might help (assuming you an get some reuse out of the actors, otherwise the overhead will just be high). I think we should have a patch in master (for the old scheduler) in the next 2 weeks though. |
|
Hey @mattearllongshot, we just merged a temporary fix for this. When you get a chance, can you retry your workload on the nightly wheels for this commit? d4537ac |
|
Sounds great. I haven't been able to test this today due to EC2 instance availability, but I'll give it another go tomorrow. |
|
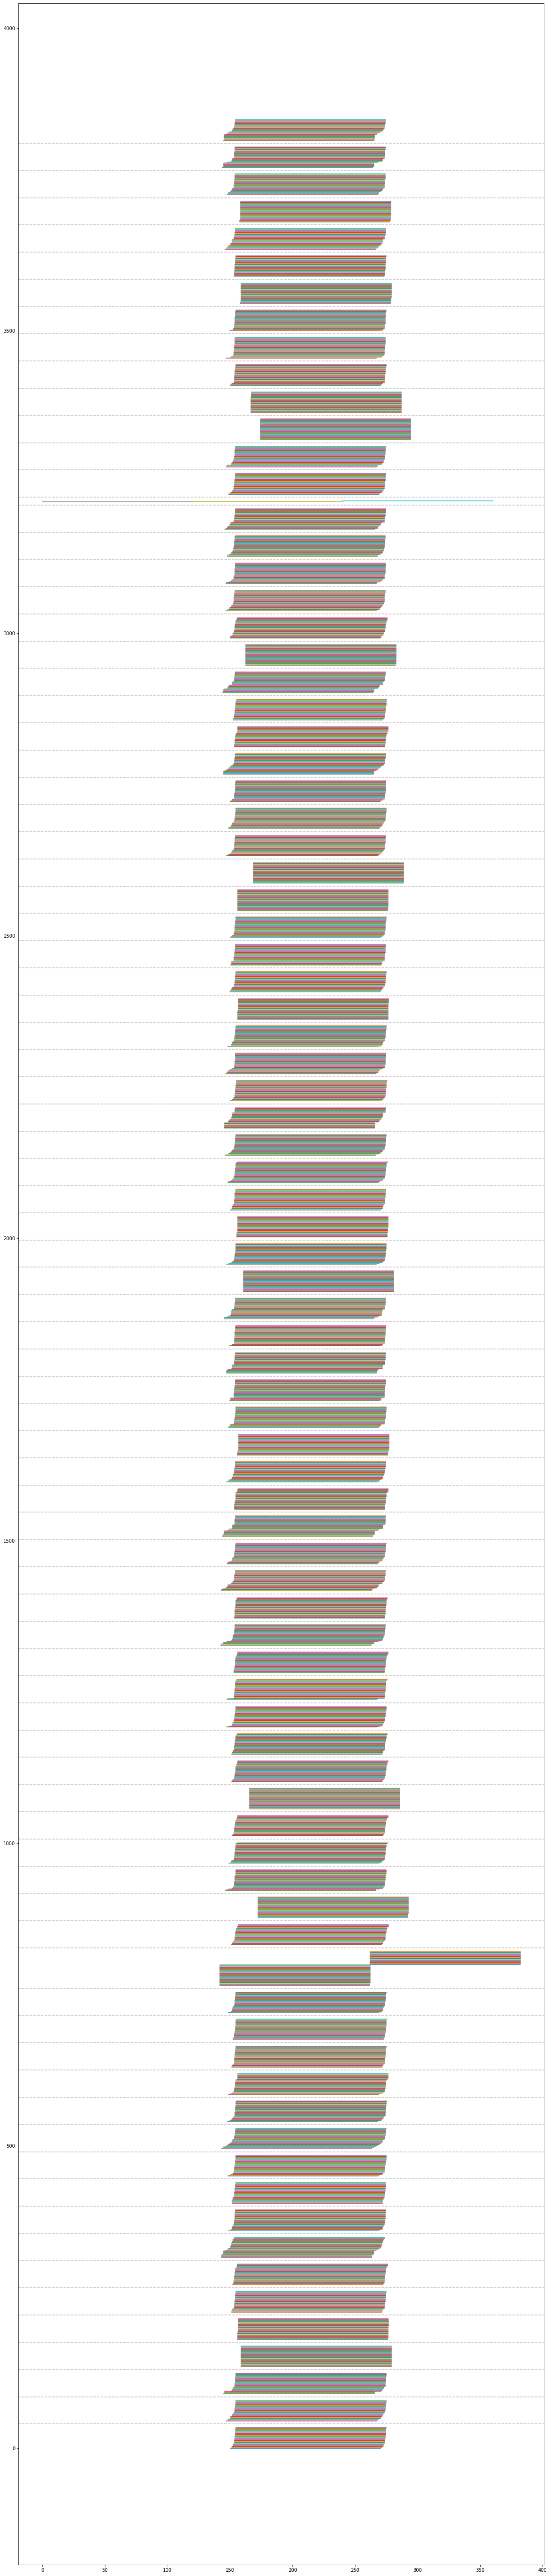
Hi @stephanie-wang , here are the results from yesterday's nightly wheel: I've added dashed horizontal lines to make it separate IPs more clearly. It seems to be more even on startup times, but a few tasks are being delayed until after the others have finished |
|
I also get these errors printed to stderr when running ray.get: errors.txt |
|
The above appears to have some instances delayed in their bringup, which perhaps could be causing the problem? I've run it again and this time the behaviour is more sensible. Here's the image: Note that one node ends up executing more than the others (57 tasks vs 35) but this is because some instances did not come up (presumably just EC2 issues) until after the over subscribed node had started its second round of tasks. No errors on stderr this time. |
|
Thanks, @mattearllongshot! I think those stderr messages match #10343 and should be fixed by the next release. I'm closing this issue for now since it seems like the scheduling issue is resolved for the moment. Please feel free to reopen if something else comes up! |
|
Great! Thanks for taking the time to fix this. Looking forward to the next release. |
What is the problem?
Ray version: 0.8.5
Python version: 3.8.1
OS: Ubuntu 18.04.4 LTS
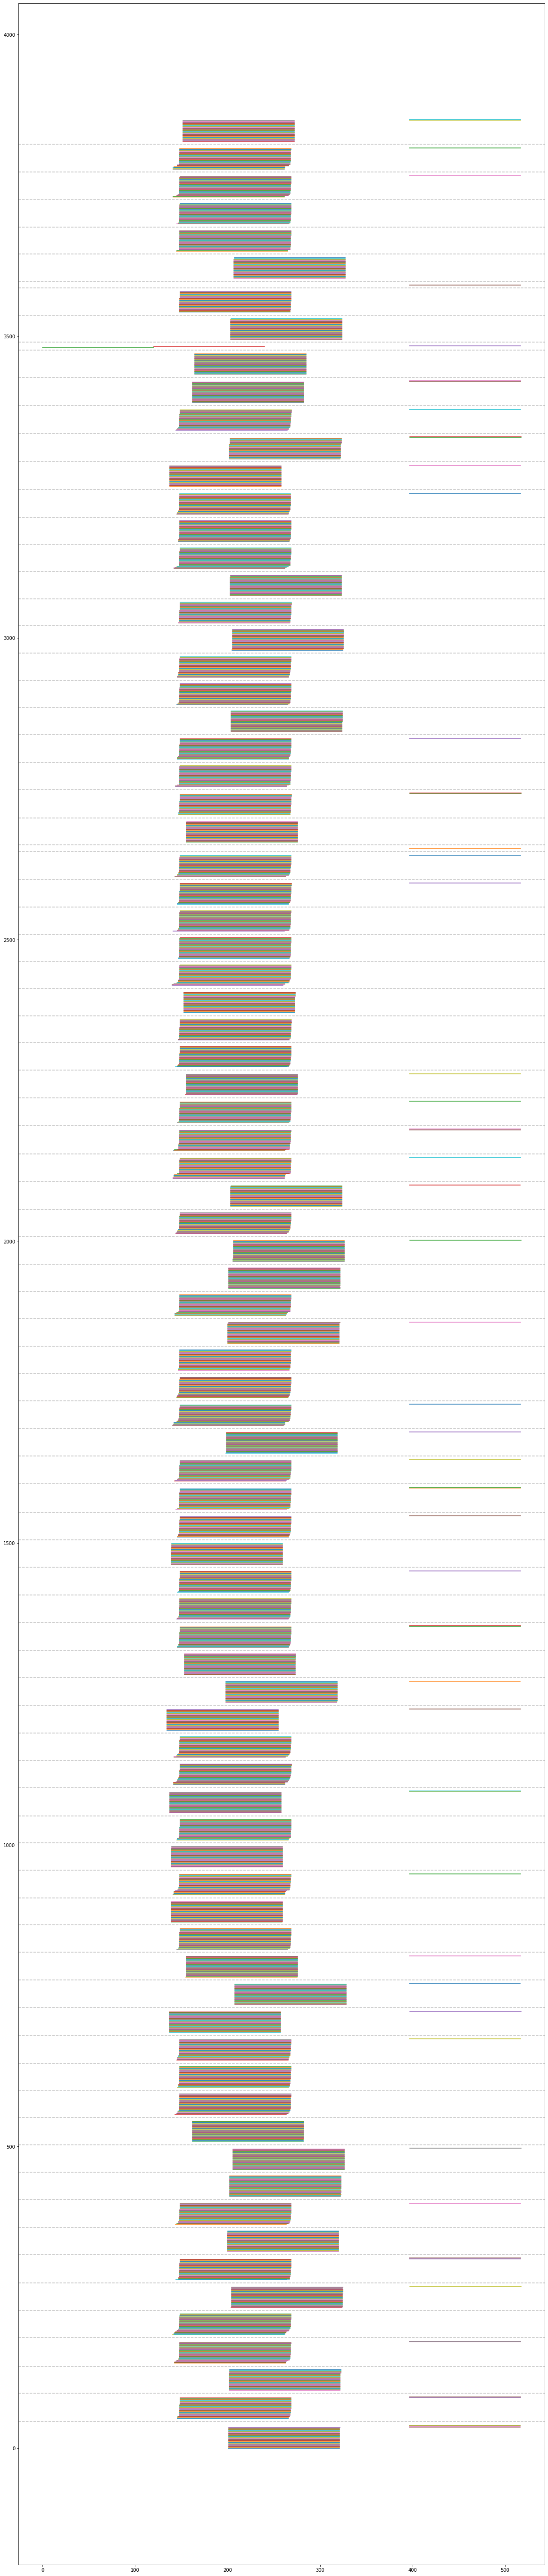
When launching 3000 tasks on an autoscaling EC2 cluster, start times are staggered by more than a minute. Here is an image illustrating this:
Each horizontal line here represents a task, and they are grouped into blocks according to node that the task is run on, and then ordered by start time. The x-axis scale is seconds. As you can see, on some nodes some tasks can start over a minute after others, even if the task is doing a simple sleep, which can extend the run time of the task / incur unnecessary EC2 charges.
Reproduction (REQUIRED)
Boot an EC2 cluster using worker types c4.8xlarge, and then run the following script. You'll need matplotlib / pandas / numpy installed to reproduce the plot, but otherwise it'll run with just ray.
At the point of running
ray.geta few errors are output, which I've attached here:errors.txt
I tried it with a smaller set of tasks (1000) but couldn't reproduce the issue.
The text was updated successfully, but these errors were encountered: