Welcome to the website for my R package, halloween! This package is created as part of the Advanced Data Science course at in the Biostatistics department at JHSPH. The purpose of this package is to plot the top-ranked halloween candies using data from this FiveThirtyEight blogpost.
The main function of this package is called plot_candy. The function takes in the following parameters:
df: The name of the data framen: The number of top candies to plot (default is 10)candy_name_col: The name of the column in the data framedfcontaining the candy namesrank_col: The name of the column in the data framedfcontaining the candy rankings
The output of the function is a ggplot object, depicting the top n ranked candies in the dataset.
In order to use the package, you must first install it from this GitHub repo, which can be done using the devtools package:
library(devtools)
devtools::install_github('[USERNAME]/halloween')
Next, you must load the R package:
library(halloween)
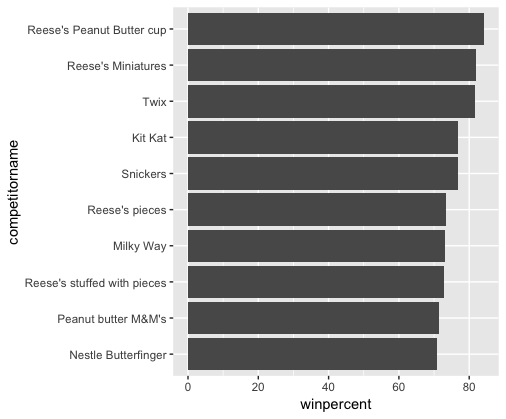
Here's an example of how to use the plot_candy() function:
plot_candy(candy_data, candy_name_col = "competitorname", rank_col = "winpercent")
Running the code above will generate the following plot: