Repository navigation
Investigate natvis for improved msvc debugging #36503
Description
Activity
The debugger will load Natvis files from C++ projects automatically. By default, Natvis files in your project are also inserted into the .pdb file built by the project. This means that if you debug the binary built by this project, the debugger loads the Natvis file from the .pdb even if you do not have the project open.
So these natvis files can either be embedded in PDB files or defined per-project, per-user or per-system (see https://msdn.microsoft.com/en-us/library/jj620914.aspx#Anchor_3). Should the Rust stdlib definitions be embedded into each rustc generated PDB file or installed in a central location? The latter option is probably going to be quite difficult given that rustup.rs is to supersede the existing installer and rustup can't do this (the natvis file will depend on the version of the standard library, thus changes with the selected toolchain). For the former option: I think the PDBs are generated by LLVM, so is there any way to tell LLVM to embed the natvis files in there?
Writing the natvis files themselves will probably be not too hard. I already got something working for
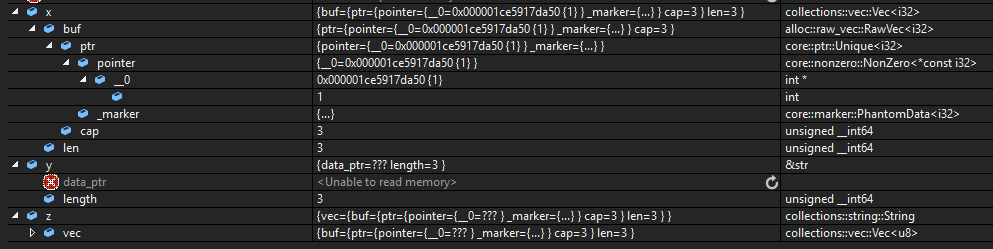
Vec. But there seems to be a problem with theu8type (alsoi8), which leads to problems withu8buffers and especiallyVec<u8>, which is why I can't get strings to work and which is also why it says<Unable to read memory>fory.data_ptrin the screenshot above. Maybe some problem with the type annotation in the PDB (either Rust's or LLVM's fault)? The other integer types work fine.Anyone who wants to try it: Just add the following as
rust.natvisto a VS solution that also contains the exe that you're debugging:<?xml version="1.0" encoding="utf-8"?> <AutoVisualizer xmlns="http://schemas.microsoft.com/vstudio/debugger/natvis/2010"> <Type Name="collections::vec::Vec<*>"> <DisplayString>{{ length={len} }}</DisplayString> <Expand> <Item Name="[length]" ExcludeView="simple">len</Item> <Item Name="[capacity]" ExcludeView="simple">buf.cap</Item> <ArrayItems> <Size>len</Size> <ValuePointer>buf.ptr.pointer.__0</ValuePointer> </ArrayItems> </Expand> </Type> </AutoVisualizer>
Also, bonus points if you can make the natvis stuff automatically generated from Debug impls.
This won't work in general, because at least for collections we still want the ability to expand and see the contained items, whereas
Debugwill just create a flat string. Also the natvis expressions have to be written in a subset of C++ and don't allow function calls.This won't work in general, because at least for collections we still want the ability to expand and see the contained items, whereas Debug will just create a flat string. Also the natvis expressions have to be written in a subset of C++ and don't allow function calls.
The idea is to hook into usage of the
Formatterdebug helper methods with some really fancy compiler black magic so it generates stuff from a high level. However I can see how it would be difficult, especially forDebugimpls with conditional code flow.Another problem I stumbled upon: I can't figure out a value for the
Typeattribute to match slices. It should be something like<Type Name="&[*]">or<Type Name="[*]">but that doesn't work, probably because square brackets are not possible in C++ type names 😢I investigated a little bit more: There is an option in the VS Debugging settings to enable (verbose) Natvis diagnostic output, and with that enabled I get an "invalid typename" error for slice types (with or without
&). I found the following code for type name matching in the MI Debug Engine for VS, which is not the native debugger, but probably very similar in this regard: https://github.com/Microsoft/MIEngine/blob/master/src/MIDebugEngine/Natvis.Impl/NatvisNames.csSo my guess was correct that only C++ types are allowed here. I don't know what's the best thing to do about it. Either get Microsoft to extend the syntax (unfortunately the native debug engine is not open source) or use the native debugger extensibility interface (see https://github.com/Microsoft/ConcordExtensibilitySamples). The latter would definitely require the installation of some extension to VS (such as VisualRust) to use it, but you probably want that anyway to have syntax highlighting and we could then also implement a custom expression evaluator that allows execution of arbitrary Rust expressions while debugging (currently you can use C++ expressions). By the way, there is no understanding of (un-)safety in the debugger obviously, but I think for a custom Rust expression evaluator it would be really interesting to take safety into consideration, so you can't easily violate Rust's safety guarantees while debugging.
After manually working around #36646 by patching the PDB, I was able to display the contents of a
Stringcorrectly:

... using these lines in the natvis file:<Type Name="collections::string::String"> <DisplayString>{vec.buf.ptr.pointer.__0, [vec.len]s8}</DisplayString> <StringView>vec.buf.ptr.pointer.__0, [vec.len]s8</StringView> </Type>
However, I found that not only are type names containing square brackets not accepted, but even
&strdoes not work (VS reportsError: Invalid type name '&str'when loading the natvis file).Reacted by pravic and LukeAs far as embedding the natvis file inside the PDB is concerned: In recent versions,
link.exehas a (mostly) undocumented switch/NATVIS. Pointing that to a natvis file will embed it into the PDB. After doing that, VS (with natvis diagnostics enabled) successfully reportsNatvis: Parsing natvis xml file: rust.natvis (from D:\Code\Rust\natvis\test\main.pdb).So we would be able to generate and embed crate-specific natvis definitions, which are probably needed e.g. to display all kinds of
enums correctly. However, natvis is really taylored to C++ and the problem with invalid type names mentioned above is still a major blocker for the natvis-only route and might require us to write a custom debugger plugin (which I think should be possible given https://github.com/Microsoft/ConcordExtensibilitySamples), and in that case we might not even need natvis (except maybe as a fallback for people who don't have the debugger plugin installed).On the other hand, we could try to convince the VS guys to accept more typenames ... I think this is really not a technical issue ...
Reacted by Kerem KatI've spent a little time looking at MSVC target debug-ability this weekend, and I wish I had found this issue sooner!
I don't think we should let perfect be the enemy of the good here - we can make most of the types in the built-in crates representable via NatVis. I really think we should go the route of injecting them into the PDBs, and that it would be cool if you could somehow tie .natvis files to crates in the Cargo manifest - when you build, all of your dependent crates' NatVis files get put in your PDB.
Reacted by Kerem KatSo a few NatViz visualizations landed in #39843; did that help with this issue? Could someone with access to MSVC check the current status here and report back on what else needs to be added?
This issue mentioned a lot of things in passing. As of rustup-provided:
rustc 1.20.0-nightly (bf0a9e0b4 2017-07-10)
rustc 1.18.0 (03fc9d622 2017-06-06)
Item Status i8/u8 Fixed in nightly str.data_ptr Fixed in nightly [1] Vec/String Implemented in stable str/[*] Unimplemented [2] Automatic .natvis selection Unimplemented [3] [1] This shows unsliced string data - e.g.
"asdf\r\n"for"\r\nasdf\r\n".trim()- so we could really use a custom visualizer.[2] "Bad" characters in typenames still prevent visualizers for these. Mangling the debug typenames to look C++y would be a welcome workaround. A custom debug engine might work OK for windows desktop, but I'm skeptical of how well it'll work for e.g. console platforms which may provide their own DEs. That said, I'm under-educated in this regard.
[3] Rustup now installs .natvis files to e.g.
%USERPROFILE%\.rustup\toolchains\nightly-x86_64-pc-windows-msvc\lib\rustlib\src\rust\src\etc\natvis\, but these aren't passed tolink.exenor does Visual Rust in any way select them.- added a commit that references this issue
on Jul 28, 2017 I really would like better enum visualization support. The Visual Studio debugger can tell you the tag of an enum and the variant name, but viewing the contents shows tuple fields for all the variants' contents and you have to guess which field(s) are correct based on the discriminant value and index them visually. It's hell trying to sift through deeply nested enums like those in the compiler frontend.
Reacted by Jason Shirk and Andrew Gaspar@abonander - indeed, I was writing a natvis entry today and the reuse of field names like __0 and __1 make it difficult to write a correct and safe natvis entry.
The best I came up with looks something like:
<Type Name="sage_core::constraint::Constraint"> <DisplayString Condition="RUST$ENUM$DISR == 0x0">{{ Binary }}</DisplayString> <DisplayString Condition="RUST$ENUM$DISR == 0x1">{{ Unary }}</DisplayString> <Expand> <Item Name="op" Condition="RUST$ENUM$DISR == 0x0">*(sage_core::constraint::BinaryOp*)(((char*)&RUST$ENUM$DISR) + 1)</Item> <Item Name="left" Condition="RUST$ENUM$DISR == 0x0">*(alloc::rc::Rc<sage_core::constraint::Constraint>*)(((char*)&RUST$ENUM$DISR) + sizeof(void*))</Item> <Item Name="right" Condition="RUST$ENUM$DISR == 0x0">*(alloc::rc::Rc<sage_core::constraint::Constraint>*)(((char*)&RUST$ENUM$DISR) + 2*sizeof(void*))</Item> <Item Name="op" Condition="RUST$ENUM$DISR == 0x1">*(sage_core::constraint::UnaryOp*)(((char*)&RUST$ENUM$DISR) + 1)</Item> <Item Name="child" Condition="RUST$ENUM$DISR == 0x1">*(alloc::rc::Rc<sage_core::constraint::Constraint>*)(((char*)&RUST$ENUM$DISR) + sizeof(void*))</Item> </Expand> </Type>
The real definition is a bit more complicated. Note the explicit/calculated offsets from the enum tag.
Reacted by Andrew Gaspar@abonander If we had this more straightforward method for mapping the discriminator to the debug information for the current value, I think that gets us a lot closer to being able to have an automatic visualizer for all enums. It would be rad, actually, if the compiler just auto-generated natvis files for all enums in builds with debuginfo, and embedded them in the PDB using the link.exe flag.
Reacted by pravic- added a commit that references this issue
on Nov 23, 2019 triage: Can this issue be closed now? Natvis is now supported by the
#![debugger_visualizer]attribute. Additionally, the standard library ships with natvis files.Reacted by MaulingMonkey and Jubileetriage: Can this issue be closed now?
Yes.
All initial problems referenced in this issue have been resolved - and while there's room for improved stdlib natvis files (and probably always will be), those are better tracked as specific, individual issues, created on a "this irritated me enough to create an issue" basis IMO.
Reacted by JubileeReacted by JubileeOk, closing as completed for the above reason.


Natvis files are used to provide user friendly visualizations of native objects in the debugger. Currently VS is able to debug Rust programs fairly well, but any sort of type with internal pointers becomes incomprehensible. By providing natvis information for these types, the user can see what is going on.
https://msdn.microsoft.com/en-us/library/jj620914
Here is a screenshot of the current situation to make it obvious what needs to be improved:
Also, bonus points if you can make the natvis stuff automatically generated from
Debugimpls. Even if something like VisualRust writes a visualizer plugin thing to do this without natvis, there still needs to be a way to hook intoDebugimpls to easily get this sort of information.