
This repo contains scripts to run a walk/drive/transit isochrone analysis of educational institution accessibility in the Houston metro area. I built it for a nonprofit think-tank but, sadly, the work never saw the light of day. With the relevant staff having left for new gigs, I think I can safely share the reusable parts.
And there's some valuable stuff here--particularly the data I collected and the research I did to join it together.
People and institutions interested in doing granular geospatial analysis of land use or population distribution in the Houston area should find much to interest them. Those wishing to analyze other parts of Texas will find a useful template, but should anticipate a future rich with time spent making FOI requests. Everyone else might learn some bash.
The software is not the main attraction here, but a few parts may be of interest:
Bash code. This repo contains nearly every bash trick I know. If you are a beginning-to-intermediate bash user, it will likely be of interest. In particular, approaches for managing a complex and long-running PostGIS ETL process can be found.
Isochrone generation. Isochrones are polygons that show how far a person can travel from a starting point in a given amount of time, for a given transit mode.
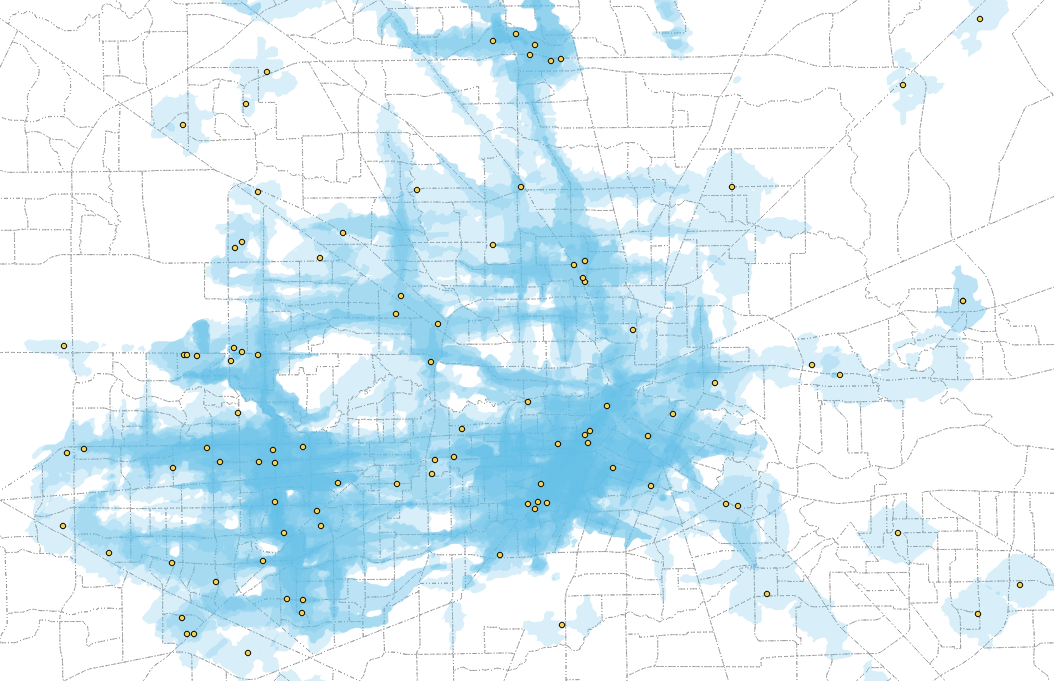
I evaluated several different services capable of generating isochrones for this project; code to access their APIs and automate the creation of these isochrones is provided. So are the isochrones corresponding to all educational institutions in the Houston area. I employed a local instance of OpenTripPlanner to generate the transit isochrones, but the work to get OTP configured to do this is not captured in this repo.
PostGIS SQL. Methods for instantiating, populating and analyzing a spatially-aware Postgres database are provided.
Once the lead investigator introduced me to this project's central question, a problem presented itself. I could generate isochrones for them, and isochrones can be quite detailed. But we were interested in accessibility--knowing how isochrones intersected with where people live. And the available data on where people live is lousy! Census geometry can be quite coarse. An isochrone might touch the western edge of a Census polygon that has a head count attached to it, but that polygon might include a huge lake or farm or industrial park along its western side.

What are we to do in this situation? Count all of that polygon's people as being reachable by the isochrone? Multiply the head count by the overlapping area where the isochrone touches the lake? No! That's dumb!
With some research, I developed a much more thorough--not to say laborious--approach.
Texas has a unified system of appraisal districts. Every county can be counted on to have a pretty good parcel shapefile, and a per-parcel tax roll dataset that includes a land use classification(!). The big counties make this easy to find and download--some even put the land use data in the shapefile. The smaller counties squirrel these files away and make you ask for them. Which I did.
Joining these two files up isn't always easy--it took lots of guessing and staring at fixed-width data files to get it right. Fortunately, the universe of vendors who serve these needs in Texas is limited, and some patterns emerged. Eventually, I templatized and refactored it, so the whole process is driven by a JSON config file. Expansions to the rest of Texas' counties might benefit from this.
In the end, we had data for Austin, Brazoria, Brazos, Chambers, Colorado, Fort Bend, Galveston, Grimes, Harris, Liberty, Matagorda, Montgomery, San Jacinto, Walker, Waller, Washington, and Wharton counties. Run these scripts and you will get a per-parcel classification of all the land in them. I then filtered the parcels to those with residential land use codes (which codes to employ varies by county, though again, there is overlap), and assigned Census demographic data from each containing polygon to parcels on a pro rata basis.

This allowed for a granular analysis of where isochrones cover the places that people live. I think it's pretty good! Certainly it lights up htop in a satisfying way for many hours. You could probably also use this approach to granularly map industrial or agricultural land use in the greater Houston area.
A more complete or at least fancier explanation of the above is available in METHODOLOGY.md, the sadly-unused description I wrote when it seemed like we were getting close to publication.
The data is stored in an S3 bucket that these scripts are configured to reach. Please grab the files once and then use your own local copy rather than racking up charges on my AWS account. It's about 2.3 GB of compressed data.
This project relies upon numerous POSIX and GNU tools as well as python3, but few unusual ones--generally speaking, it's stuff that's equally available in a default OS X or Ubuntu environment. jq and the gdal-bin packages are the only dependencies you're likely to need to install. pv is optional.
You're going to need a beefy PostGIS instance. To adapt the scripts to your needs, you're probably going to need some bash and python chops. Once you have those, head to conf.sh.
These scripts generate repeatable results that were scrutinized for plausibility by professional social scientists. I have since scrubbed the project to avoid implying any endorsement by the sponsoring organization. The system has been tested for operability since, but its output has not been scrutinized.
To initialize the database:
./initdb.sh
To run the script:
./do_it_all.sh
The latter script is just a call to ISOCHRONES=1 RETAIN=1 PARCELS=1 ANALYSIS=1 ./reload_data.sh (which subsequently invokes analysis.sh). Set any one of those variables to 0 to skip the phase it represents (useful if you're working on one part of the code).
Running this will take hours and generate a very large number of TSV files that analyze a problem that you probably don't care about! Setting ANALYSIS=0 will avoid some of the expensive computation of Census statistics and instead just leave you with the processed parcel layer.
I will be glad to answer your questions. thomas.j.lee (at) gmail (dot) com.
All applicable project material is offered under the BSD-3 clause license (see below).
I am not the author or owner of the data files used by this project. I hold no copyright or other intellectual property interest in them. To the extent that their use requires authorization, I am unable to grant it. At the time of this writing I am not aware of any limitations on the data's use or redistribution. Much of it was obtained directly from the relevant government authorities' publicly accessible web and/or FTP sites, or via public records requests. The information is factual in nature and of public interest, but users are encouraged to consult a lawyer regarding its use and, especially, any planned redistribution. I cannot and will not assume any responsibility for use of the data or any consequences arising from its use, which is at your own risk.
If you hold an interest in any of the data referenced by this project and believe it has been made available in error, I encourage you to contact me using the email address listed above.
Copyright 2022 Thomas Lee
Redistribution and use in source and binary forms, with or without modification, are permitted provided that the following conditions are met:
-
Redistributions of source code must retain the above copyright notice, this list of conditions and the following disclaimer.
-
Redistributions in binary form must reproduce the above copyright notice, this list of conditions and the following disclaimer in the documentation and/or other materials provided with the distribution.
-
Neither the name of the copyright holder nor the names of its contributors may be used to endorse or promote products derived from this software without specific prior written permission.
THIS SOFTWARE IS PROVIDED BY THE COPYRIGHT HOLDERS AND CONTRIBUTORS "AS IS" AND ANY EXPRESS OR IMPLIED WARRANTIES, INCLUDING, BUT NOT LIMITED TO, THE IMPLIED WARRANTIES OF MERCHANTABILITY AND FITNESS FOR A PARTICULAR PURPOSE ARE DISCLAIMED. IN NO EVENT SHALL THE COPYRIGHT HOLDER OR CONTRIBUTORS BE LIABLE FOR ANY DIRECT, INDIRECT, INCIDENTAL, SPECIAL, EXEMPLARY, OR CONSEQUENTIAL DAMAGES (INCLUDING, BUT NOT LIMITED TO, PROCUREMENT OF SUBSTITUTE GOODS OR SERVICES; LOSS OF USE, DATA, OR PROFITS; OR BUSINESS INTERRUPTION) HOWEVER CAUSED AND ON ANY THEORY OF LIABILITY, WHETHER IN CONTRACT, STRICT LIABILITY, OR TORT (INCLUDING NEGLIGENCE OR OTHERWISE) ARISING IN ANY WAY OUT OF THE USE OF THIS SOFTWARE, EVEN IF ADVISED OF THE POSSIBILITY OF SUCH DAMAGE.