A set of MATLAB functions that provide an easy to use API for plotting lines with markers. The purpose for this library is to make it easier to generate charts and graphs for publications which may be published or printed in black and white. The functions are all prefixed with MPM which stands for MATLAB Plot with Marker.
For a sample usage see Test.m.
Example 1. Plotting sin(x) without markers:
x1 = 1:0.01:10;
line1 = sin(x1);

MPM_NewPlot;
MPM_AddLine(line1, 'sin(x)');
MPM_Plot;
The order of statements are important:
MPM_NewPlot: initializes a new plot (by resetting global variables).
MPM_AddLine: adds a line to be plotted. The line must be a 1-D vector. The second argument is optional and specifies the label of the line in the legend.
MPM_Plot: plots the lines added by previous calls to MPM_AddLine.
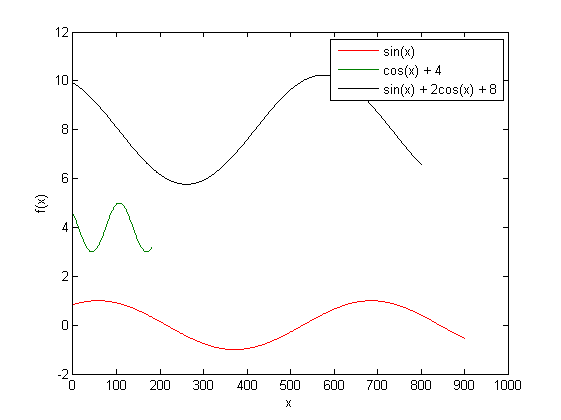
Example 2. Plotting 3 lines:
x1 = 1:0.01:10;
line1 = sin(x1);
x2 = 1:0.05:10;
line2 = cos(x2) + 4;
x3 = 1:0.01:9;
line3 = sin(x3) + 2*cos(x3) + 8;

MPM_NewPlot;
MPM_AddLine(line1, 'sin(x)');
MPM_AddLine(line2, 'cos(x) + 4');
MPM_AddLine(line3, 'sin(x) + 2cos(x) + 8');
MPM_Plot;

xlabel('x');
ylabel('f(x)');
Note that xlabel and ylabel are standard MATLAB functions that specify the labels for the chart. The above code produces:
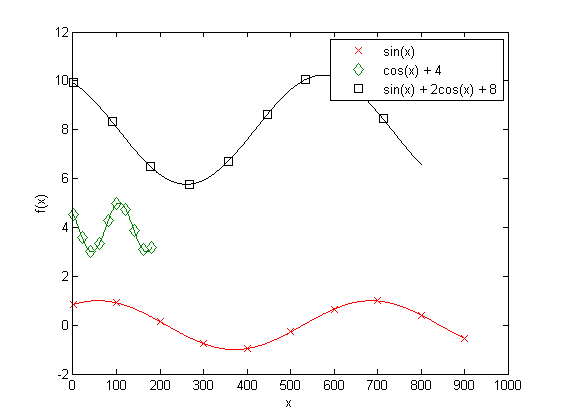
Example 3. Adding markers. Imagine that we wish to add 10 markers to each plotted line, so that the chart would become easier to read, especially when printed in black and white. The markers will be spread with unified distances from each other throughout the line:
x1 = 1:0.01:10;
line1 = sin(x1);
x2 = 1:0.05:10;
line2 = cos(x2) + 4;
x3 = 1:0.01:9;
line3 = sin(x3) + 2*cos(x3) + 8;

MPM_NewPlot;
MPM_SetMarkerCount(10);
MPM_AddLine(line1, 'sin(x)');
MPM_AddLine(line2, 'cos(x) + 4');
MPM_AddLine(line3, 'sin(x) + 2cos(x) + 8');
MPM_Plot;

xlabel('x');
ylabel('f(x)');
MPM_SetMarkerCount specifies the number of markers to be put on the line.
The above code produces the following chart:
Example 4. Making the lines fixed width. It's sometimes desirable to make different lines the same width (e.g., when the data were generated with different scales, but for a fixed value of x). For this purpose one can use MPM_SetFixedLength to specify common width for all the lines. The library will sample or interpolate data if needed to make the lines of the same width:
x1 = 1:0.01:10;
line1 = sin(x1);
x2 = 1:0.05:10;
line2 = cos(x2) + 4;
x3 = 1:0.01:9;
line3 = sin(x3) + 2*cos(x3) + 8;

MPM_NewPlot;
MPM_SetMarkerCount(10);
MPM_SetFixedLength(600);
MPM_AddLine(line1, 'sin(x)');
MPM_AddLine(line2, 'cos(x) + 4');
MPM_AddLine(line3, 'sin(x) + 2cos(x) + 8');
MPM_Plot;

xlabel('x');
ylabel('f(x)');
grid;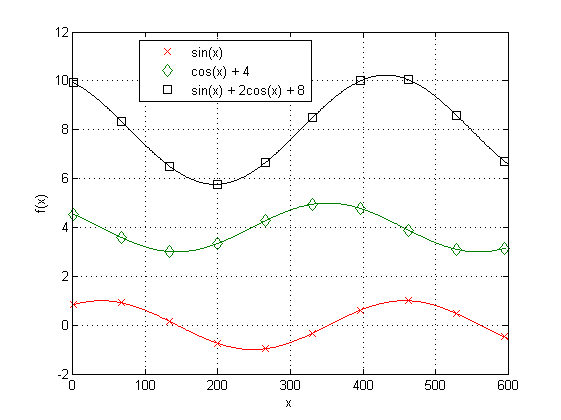
This library is hosted on GitHub.
Licensed under MIT