- What Is This?
- Assumptions
- What's In Here?
- Bootstrap The Project
- Using A Stable Version
- Configuration
- Run The Project
- Add A New Graphic
- Clone Old Graphic
- Deploy To S3
- Test Capabilities
- Embedding
- Connecting To A Google Spreadsheet
- Open Linked Google Spreadsheet
- Using Jinja Filter Functions
- Storing Media Assets
- Creating Locator Maps
- Creating Animated Photos
- Creating An ai2html Graphic
- Adding A New Graphic Template
- Working With Carebot
- Keeping The Graphics Directory Clean
- Generating Copyedit Notes
dailygraphics is a framework for creating and deploying responsive graphics suitable for publishing inside a CMS with pym.js.
In addition to big, long-term projects, the NPR Visuals team also produces short-turnaround charts and tables for daily stories. Our dailygraphics rig offers a workflow and some automated machinery for creating, deploying and embedding these mini-projects, including:
- Version control (with GitHub)
- One command to deploy to Amazon S3
- A mini-CMS for each project (with Google Spreadsheets)
- Management of binary assets (like photos or audio files) outside of GitHub
Full Blog Post: Creating And Deploying Small-Scale Projects
- Responsive Charts With D3 And Pym.js
- Making Data Tables Responsive
- Managing Instagram Photo Call-Outs
- Baking Chart Data Into Your Page
- Let’s Tesselate: Hexagons For Tile Grid Maps
- Simplifying Map Production
This codebase is licensed under the MIT open source license. See the LICENSE file for the complete license.
Please note: logos, fonts and other media referenced via url from this template are not covered by this license. Do not republish NPR media assets without written permission. Open source libraries in this repository are redistributed for convenience and are each governed by their own license.
Also note: Though open source, this project is not intended to be a generic solution. We strongly encourage those who love dailygraphics to use it as a basis for their own project template. We have no plans to remove NPR-specific code from this project.
The following things are assumed to be true in this documentation.
- You are running OSX.
- You are using Python 2.7. (Probably the version that came with OSX.)
- You have virtualenv and virtualenvwrapper installed and working.
- You have your Amazon Web Services credentials stored as environment variables locally.
For more details on the technology stack used with this project, see our development environment blog post.
The project contains the following folders and important files:
etc-- Miscellanous Python libraries.fabfile-- Fabric commands for automating setup and deployment.graphic_templates-- Folder templates for different graphic types.templates-- HTML (Jinja2) templates, to be compiled locally.app.py-- A Flask app for rendering the project locally.app_config.py-- Global project configuration for scripts, deployment, etc.graphic.py-- Flask views for rendering graphics.graphic_templates.py-- Flask views for rendering graphics templates.oauth.py-- Flask views for configuring OAuth (for Google Spreadsheets).package.json-- Node requirements.render_utils.py-- Code supporting template rendering.requirements.txt-- Python requirements.
Node.js is required for the static asset pipeline. If you don't already have it, get it like this (requires brew):
brew install node
Then set up the project like this:
git clone https://github.com/nprapps/dailygraphics.git
cd dailygraphics
mkvirtualenv dailygraphics
pip install -r requirements.txt
npm install
You'll now need to create a folder to hold the graphics created and deployed by this rig. This is configured in app_config.GRAPHICS_PATH and defaults to ../graphics.
NPR users: Graphics are stored in a separate, private repository, and app_config.GRAPHICS_PATH points to that folder. You will need to separately git clone that repository.
All other users: You can choose to keep your work in a separate repository, as we do, or you can change the app_config.GRAPHICS_PATH to point to a folder inside of dailygraphics.
The master branch of project is in active development by NPR at all times. If you would like to use a [more] stable version, we suggest checking out a tagged version (0.1, etc.). We will periodically tag releases, which will be synchronized to the CHANGELOG so you will know exactly what improvements you will get if you migrate to a new tagged version.
To see available tagged versions, run:
git tag -l
To use a tagged version run, for example:
git checkout 0.1.0
To upgrade to a newer tagged version just check it out:
git checkout 0.2.0
When upgrading from one tagged version to another, please be sure to update your Python requirements:
pip install -Ur requirements.txt
The dailygraphics project configuration defaults are specific to NPR. If you want to use it in your newsroom you should fork this repository and update app_config.py with your own configuration.
At a minimum you will want to change REPOSITORY_URL, PRODUCTION_S3_BUCKETS, STAGING_S3_BUCKETS and ASSETS_S3_BUCKET. (ASSETS_S3_BUCKET must be different from the other buckets.)
Google OAuth
The default configuration assumes that you want to use NPR's copytext rig to pull content from a Google Spreadsheet. If you do not want to use Google Spreadsheets at all, delete all instances of graphic_config.py from the template folders inside graphic_templates. You can skip the OAuth steps below.
As of April 2015, we've changed our approach to authenticating with Google to sync Google Spreadsheet data. Now, dailygraphics relies on OAuth authentication. This approach is more secure (username and password are no longer stored in environment variables) and works for accounts with two-factor authentication enabled.
Following the steps in this blog post, you will need to:
- Set up a Google API application for your organization
- Save the client environment variables in your
.bash_profile - Authenticate with Google.
You should only need to do this once.
NPR users: The environment variables you need have already been generated, so you can skip the first step. Contact Alyson or Juan for more information.
A Flask app is used to run the project locally. It will automatically recompile templates on-demand.
workon dailygraphics
fab app
Visit localhost:8000 for a list of graphics in the repo. Click on the graphic you are working on to view it. Alternately, visit http://localhost:8000/graphics/$SLUG in your browser to view the specific graphic you are working on.
Do you use iTerm2 as your terminal app? Here's a sample AppleScript to automatically launch a three-paned terminal window (one for the dailygraphics machine, one for the local webserver, and another for the separate graphics repo).
You can save this locally, customize it to match your own configuration and add an alias for it to your .bash_profile.
alias dailygraphics="osascript ~/PATH-TO-FILE/iterm_dailygraphics.scpt"
Do you get an error that looks like this when you run the webserver?
Fatal error: local() encountered an error (return code 1) while executing 'gunicorn -b 0.0.0.0:8000 --debug --reload app:wsgi_app'

Aborting.
It's possible that the webserver is already running silently in the background. Here's how to fix it.
dailygraphics includes starter code for a few different types of graphics (and we're slowly adding more as we go). Running any of these commands will create the folder $SLUG within your app_config.GRAPHICS_PATH folder. Within the new folder will be a child_template.html file and some boilerplate javascript files. child_template.html is a Jinja template that will be rendered with a context containing the contents of app_config.py, graphic_config.py and the COPY document for that graphic. It also will clone a new Google Spreadsheet for you to use for text and data.
Build out your graphic in child_template.html, and put your javascript in js/graphic.js.
| Image | Type | Fab command |
|---|---|---|
 |
Very basic new graphic | fab add_graphic:$SLUG |
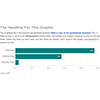 |
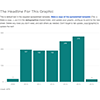
Bar chart | fab add_bar_chart:$SLUG |
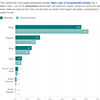 |
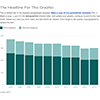
Grouped bar chart | fab add_grouped_bar_chart:$SLUG |
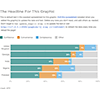 |
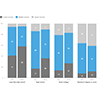
Stacked bar chart | fab add_stacked_bar_chart:$SLUG |
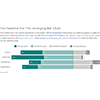 |
Diverging bar chart | fab add_diverging_bar_chart:$SLUG |
 |
Column chart | fab add_column_chart:$SLUG |
 |
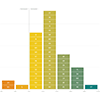
Stacked column chart | fab add_stacked_column_chart:$SLUG |
 |
Stacked grouped column chart | fab add_stacked_grouped_column_chart:$SLUG |
 |
Block histogram | fab add_block_histogram:$SLUG |
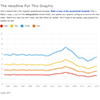 |
Line chart | fab add_line_chart:$SLUG |
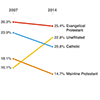 |
Slopegraph | fab add_slopegraph:$SLUG |
 |
Dot chart | fab add_dot_chart:$SLUG |
 |
Locator map | fab add_map:$SLUG |
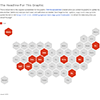 |
State grid map | fab add_state_grid_map:$SLUG |
 |
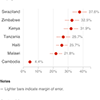
Responsive HTML table | fab add_table:$SLUG |
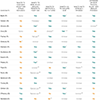 |
A table comparing a list of candidates' positions on various issues | fab add_issue_matrix:$SLUG |
 |
Animated photo (GIF alternative) | fab add_animated_photo:$SLUG |
Note: $SLUG should be URL-safe, e.g., lowercase and with dashes instead of spaces and no special characters.
Here are some examples:
- Good: my-project-name
Bad: My-Project-NAME - Good: my-project-name
Bad: my project name - Good: my-wonderful-project
Bad: my wonderful project!
Dailygraphics by default will append the current date to your slug name, YYYMMDD-style -- for example: my-project-name-20170415. This is for clarity and to help prevent ovewriting existing projects. You can also manually specify a date. If the date you specify is not a valid date, dailygraphics will use the current date instead.
When you create a new project, dailygraphics will check against your local projects and the projects published to production to make sure that the $SLUG (plus date) you've chosen does not already exist.
If you want to use an old graphic as a starting point for a new graphic -- with a new instance of the graphic's spreadsheet so you don't overwrite the old content -- use this command:
fab clone_graphic:$OLD_SLUG,$NEW_SLUG
It will search for a given slug in our graphics and graphics-archive repositories and clone it, creating a new ready-to-work-on graphic.
The first (required) parameter -- $OLD_SLUG -- is the graphic slug you are trying to clone. The second parameter -- $NEW_SLUG -- is optional. If specified, it will be used to generate the new graphic slug. Otherwise, if no $NEW_SLUG is specified, the new graphic slug will be derived from the $OLD_SLUG, replacing the date at the end of the slug with the current date (or, if $OLD_SLUG did not include a date, appending the current date at the end).
Examples (if today was 20160705):
fab clone_graphic:my-project-name-20150415,my-new-project-20160706
// Results in my-new-project-20160706
fab clone_graphic:my-project-name
// Results in my-project-name-20160705
fab clone_graphic:my-project-name-20150415
// Results in my-project-name-20160705
fab clone_graphic:my-wrong-project-name-20150415
// Results in an error if not found in graphics or graphics-archive repos
To deploy a specific graphic:
fab staging deploy:$SLUG
fab production deploy:$SLUG
You can deploy multiple graphics with a single command by passing the slugs as a comma-separated list (no spaces). To deploy multiple graphics at once:
fab staging deploy:$SLUG1,$SLUG2
fab production deploy:$SLUG1,$SLUG2
At NPR, we occasionally need to redeploy old graphics in our graphics-archive repo. The deployment command supports passing either a relative path to the graphic from dailygraphics or by passing an absolute path. This functionality can be used to render and deploy graphics that are outside the GRAPHICS_PATH location in app_config.py as long as the graphic has the templates and files required for graphics created by dailygraphics.
fab staging deploy:"path"
fab production deploy:"path"
Wrapping the path in quotes is needed if the path contains spaces.
To deploy a specific archived graphic:
fab staging deploy:"../graphics-archive/2016/01/100-words-20160122"
fab staging deploy:"/home/user/Projects/graphics-archive/2016/01/100-words-20160122"
Dependent fabric commands are also available, including render and update_copy. For example:
fab staging render:"../graphics-archive/2016/01/100-words-20160122"
fab staging update_copy:"../graphics-archive/2016/01/100-words-20160122"
You can deploy multiple graphics with a single command by passing the slugs as a comma-separated list (no spaces). To deploy multiple graphics at once:
fab staging deploy:path1,path2
Warning: There is no preview available for these changes and deployments. If you need to make a significant change or actively work on a graphic outside of the primary graphics folder, it may be better to clone the graphic and start fresh.
At NPR, we recently had to update all of our past graphics to faciltate the site's switch to https. We have introduced test capabilities to trim down the review process for this project -- but this functionality can and probably should be a part of our regular deployment.
Our basic test functionality uses selenium for python and chrome webdriver to launch and validate the deployment url for a graphic or multiple graphics. The process makes a screenshot of the Chrome page and writes a log of the warnings, errors and console.log() statements that we may find.
-
Selenium is included in our
requirements.txt. -
To use chrome webdriver, download and unzip the corresponding version for your platform and put it somewhere on the
$PATHso that selenium can find it. (You could include the path to the binary on the webdriver call but let's stick to only one approach.)
As an alternative to chrome-webdriver, you can use phantomjs. However, we have found that the browser logging granularity is a bit worse. To install phantomjs:
$ brew install phantomjs
There are other drivers (see here) that you could use, and it should be quite straightforward to modify the code to do that. Since this is not intended as a cross-browser test, sticking to one browser serves our needs.
Important: The testing functionality assumes that the graphic has already been deployed and its corresponding url is accessible.
Once you have installed the needed binaries and libraries we are ready to start testing.
The main entry point is a fabric task:
fab $ENV test:path
Where $ENV should be replaced by the desired environment staging or production
You could do them on more than one graphic by separating paths with commas
fab $ENV test:path1,path2
If you need/want to run the test on more than a couple of graphics we have you covered, you can use the bulk_test fabric task
fab $ENV test.bulk_test:$CSVPATH
$CSVPATH is an absolute or relative path to the location of a csv file that will have either one path to a graphic per line or one url per line.
If a path is given on each line the task will use the provided $ENV to calculate the deployed url and test it.
If a url is given on each line you do not need to specify a $ENV since the url is already provided.
As a result the test rig will create a screenshot and a logfile for each graphic inside test folder. If bulk_test is used it will create a subfolder with the timestamp and inside it it will create a logfile for all the process and a screenshot for each graphic.
If there's an existing graphic report (screenshot + log) for a given graphic and environment and you run the test for that same configuration again the report will be overwritten, let's save some space right?
All the fabric tasks mentioned above have some behavior that can be customized:
use: Which webdriver to use on the tests, defaults toChromescreenshot: Whether to make a screenshot or not of the tested page, defaults toTruepymParent: Whether we want to reinforce a communication protocol on Pym to ensure that the page has loaded correctly, defaults toFalse
Let's say we have installed phantomjs and want to test using that webdriver, we could run:
$ fab $ENV test:path,use='phantom'
Let's say we do not want a screenshot to be taken for one of our bulk tests:
$ fab $ENV test.bulk_test:$CSVPATH,screenshot=False
Let's say we are using the rendered index page for our graphic and want to enforce Pym.js communication prior to checking our page.
$ fab $ENV test:path,pymParent=True
Deploy the project to production. Visit http://apps.npr.org/dailygraphics/graphics/$SLUG, and on that page should be an iframe with your graphic inside of it, and an embed code below the graphic. Paste the embed code into your page. (Some CMSes treat code snippets like this as a separate "HTML asset.")
This section describes usage of NPR's copytext rig for syncing text from a Google Spreadsheet.
When you create a new graphic, dailygraphics will by default clone our dailygraphics copy spreadsheet template. To use a different spreadsheet (either in your graphics templates or in a particular project), update the graphic_config.py file in your graphic's folder with the ID of your spreadsheet:
COPY_GOOGLE_DOC_KEY = '0AlXMOHKxzQVRdHZuX1UycXplRlBfLVB0UVNldHJYZmc'
Run this command to pull down the latest copy of the spreadsheet:
fab update_copy:$SLUG
Alternately, while you are developing your graphic locally, you can append ?refresh=1 to your graphic's localhost URL to refresh the spreadsheet every time you refresh the page. (It can be a little slow, though, so it might be most efficient to do this only when you’re actively working on the spreadsheet.)
To pull down all spreadsheets in the dailygraphics repository, run:
fab update_copy
The deploy process will always pull down the latest spreadsheet and render the contents to your page.
Note: Your published graphic will not automatically update every time your spreadsheet updates. It will only update when you deploy (or redeploy) it. For projects that seldom change, this is usually fine. Consider another solution if you need dynamic updates.
If you do not want want to use the copytext spreadsheet for a given project, you can either set COPY_GOOGLE_DOC_KEY to None or delete the graphic_config.py file entirely.
Want to edit/view a graphic's linked google spreadsheet, we got you covered.
We have created a simple Fabric task open_spreadsheet that requires a graphic slug. It will try to find and open the graphic's linked google spreadsheet on your default browser. In order to find the graphic it will first try on the graphics path defined in app_config.GRAPHICS_PATH and then on the graphics-archive path defined in app_config.ARCHIVE_GRAPHICS_PATH
fab open_spreadsheet:$SLUG
A library of Jinja filter functions for common tasks (ordinal, AP date format, etc.) is included with each graphic.
If your graphic requires complex number formatting or other nuanced presentation, you may need to write a custom filter function. This is supported through each project's graphic_config.py file. To add a custom filter function, simply define it and add it to the list called JINJA_FILTER_FUNCTIONS, like so:
def percent(value):
    return unicode(float(value * 100)) + '%'

    JINJA_FILTER_FUNCTIONS = base_filters.FILTERS + [percent]
Then you will be able to use it in your template like this:
<td>{{ row.value|percent }}</td>See the table graphic template for a more complete example.
(Note: this section describes usage of NPR's assets rig. This is optional and you don't need to use it in order to use dailygraphics.)
Large media assets (images, videos, audio) are synced with an Amazon S3 bucket configured in app_config.ASSETS_S3_BUCKET in a folder with the name of the project. This allows everyone who works on the project to access these assets without storing them in the graphics repository, giving us faster clone times and the ability to open source our work.
When you use one of the supported fab commands to create a new graphic (e.g., fab add_graphic:$SLUG), your graphic folder will include an assets folder. Files stored here will not go up to GitHub, but will sync with S3.
Syncing these assets requires running a couple different commands at the right times. When you create new assets or make changes to current assets that need to get uploaded to the server, run fab assets.sync:$SLUG. This will do a few things:
- If there is an asset on S3 that does not exist on your local filesystem it will be downloaded.
- If there is an asset on that exists on your local filesystem but not on S3, you will be prompted to either upload (type "u") OR delete (type "d") your local copy.
- You can also upload all local files (type "la") or delete all local files (type "da"). Type "c" to cancel if you aren't sure what to do.
- If both you and the server have an asset and they are the same, it will be skipped.
- If both you and the server have an asset and they are different, you will be prompted to take either the remote version (type "r") or the local version (type "l").
- You can also take all remote versions (type "ra") or all local versions (type "la"). Type "c" to cancel if you aren't sure what to do.
Unfortunately, there is no automatic way to know when a file has been intentionally deleted from the server or your local directory. When you want to simultaneously remove a file from the server and your local environment (i.e. it is not needed in the project any longer), run fab assets.rm:"$SLUG/assets/file_name_here.jpg"
There's a private subfolder inside assets. Files inside that private folder will be synced to the Amazon S3 bucket configured in app_config.ASSETS_S3_BUCKET but will not be pushed to the final graphic location and thus will not be publicly accesible. You can use the assets/private folder to share assets with your team but not expose them publicly.
The new locator map template is designed to simplify creating basic locator maps with D3, TopoJSON and Natural Earth data. It will not create production-ready maps, but it will quickly generate a code-based starting point for a map project.
To generate the necessary TopoJSON file, you will need to install the mapturner library. Mapturner also requires ogr2ogr/GDAL and topojson. See the mapturner docs for set-up information.
(Note: The code in our example is tailored for a map centered on Nepal. You'll want to edit the configuration, JavaScript and LESS accordingly.)
To get started, create a new graphic using that template:
fab add_map:$slug
Inside the project folder, edit the configuration file geodata.yaml to specify the particular layers and data columns you want. Options included:
bbox: The bounding box for your map. To get coordinates (x1 y1 x2 y2, space-delimited) appropriate to your project, go to a site like Bounding Box, draw a box around the area you want (with a good amount of margin), and copy the coordinates of that box. (If you're using Bounding Box, choose the "CSV" coordinate output and replace the commas with spaces.)- Default layers:
countries,cities(for the primary/featured country),neighbors(for neighboring countries),lakesandrivers. The default layers point to Natural Earth shapefiles. mapturner also supports geoJSON and CSVs with latitude and longitude columns. - For each shapefile layer, you can specify options to pass to the TopoJSON converter, including:
id-property: a column value you want to use as an identifier in the exported TopoJSON fileproperties: columns you want TopoJSON to preserve in the exported file (by default, it strips out most non-geo data)where: a query to pass in to filter the data returned (for example:where: adm0name != 'Nepal' AND scalerank <= 2)
(See the mapturner docs for more details.)
In your terminal, in the dailygraphics virtualenv, navigate to your project folder. Run mapturner to process your map's geodata:
mapturner geodata.yaml data/geodata.json
In your project's js/graphic.js, change the primaryCountry variable in the renderLocatorMap config options from Nepal to the name of your featured country. To fine-tune the positioning of your map, adjust the defaultScale and aspect ratio variables, or specify an offset position in pixels by passing a pixelOffset config option as [ X_OFFSET, Y_OFFSET].
The animated photo template uses the canvid JavaScript library as an alternative to GIFs. With this solution, you composite a "filmstrip" of all the frames in your animation, and canvid plays them back in sequence on a canvas element. See an example on NPR.org.
Benefits of this approach:
- You can use JPGs rather than GIFs, allowing you to have better image quality and smaller file sizes.
- You can sub out different-sized images depending on the browser dimensions.
- You can control playback -- play, pause, reverse, etc.
- It will autoplay on iOS (unlike a video).
Since it's code-based, it's not quite as portable as a GIF. (So our script that creates the filmstrips also generates a GIF version for social media.) But in the context of a web page that you otherwise control, the benefits are pretty great. (A similar but more code-intensive approach: Filmstrip animations with CSS/JS.)
This template relies on ImageMagick's montage function to create the filmstrip image and animated GIF. If you don't have it, install it with:
brew install imagemagick
To create a new animated photo, run:
fab add_animated_photo:$slug
Add the frames for your animation to img/frames/ (in your project folder). (An image sequence from NASA is in there as an example. You can delete those.) All frames must be the same size.
Then, on the command line, navigate to your project folder and run the image processing script to create filmstrips at three different sizes.
bash process.sh
In js/graphic.js, you will need to edit two lines of code.
First, update the number of frames, columns and speed of your animation.
videos: {
    // frames = # of stills
    // cols = # of stills in a row in the filmstrip. in this case,
    //        same as frames.
    // fps = frames per second (animation speed). integers only
    photo: { src: sprite, frames: 8, cols: 8, fps: 2 }
Second, adjust the image aspect ratio (so it scales correctly in the browser). If you do not know the exact aspect ratio (like 16:9, etc.), enter the height and width (in that order) of one of your frames.
// multiply by height, width of original image
height: Math.floor(containerWidth * 1614/1500),
The ai2html template uses an open-source script called ai2html to convert Illustrator graphics to HTML and CSS and display them in our responsive dailygraphics template.
To use this template, you'll need to install ai2html as an Illustrator
script. Copy the latest version of the script here
into the Illustrator folder where scripts are located.
For example, on Mac OS X running Adobe Illustrator CC 2015, the path would be:
/Applications/Adobe Illustrator CC 2015/Presets.localized/en_US/Scripts/ai2html.jsx
You only need to install the script once on your machine. To check whether you have it installed, open Adobe Illustrator and look for the "ai2html" command in File >> Scripts.
To create a new ai2html graphic, run:
fab add_ai2html_graphic:$slug
The basic project includes an Illustrator file in assets, which you'll
use to create your graphic. The three artboards in the file are the
three breakpoints for your graphic, allowing you to create custom
versions for mobile, tablet and desktop-sized screens. (If you want to
change the width of these artboards, you'll need to adjust the media
queries in css/graphic.less.)
You can only use fonts that are supported on our website, so make sure you are using the correct typeface and weight. Here's a list of supported fonts. (For users outside of NPR, refer to the ai2html docs to learn how to customize your fonts.)
Create your graphic within Illustrator, referring to the ai2html documentation for help. When you're ready to export, run File >> Scripts >> ai2html. The resulting graphic will appear within the base template when you load your graphic!
To create and use a new graphic template, you will need to follow several steps:
First, choose a suitable existing template and copy its folder. For example:
cd graphic_templates
cp -r line_chart scatterplot
Second, open the COPY Google Spreadsheet for the pre-existing graphic template ("line_chart" in the example above). Make a copy of this document and adjust the headline in the copy to match the new chart type. Be sure to make this new spreadsheet public. (Share > Get Shareable Link > Can View). Copy the key for the new spreadsheet from the URL and paste it into the graphic_config.py for your new template.
Third, modify the new template to render your new chart type. Remove any dependencies you don't need for this graphic type. You can test your graphic template using the local server, for instance: http://localhost:8000/templates/scatterplot/?refresh=1
Before you can use your new template you'll also need to add a fab command. In fabfile/__init__.py scroll down to the tasks for creating graphics and add a task for your new template, like this:
@task
def add_scatterplot(slug):
    """
    Create a scatterplot.
    """
    _add_graphic(slug, 'scatterplot')
Finally, commit your new graphic template and your fabfile changes. Your new graphic template is now ready to use.
This section is relevant to NPR users of the dailygraphics rig.
Carebot is a grant-funded project to measure and report more meaningful analytics around stories and story elements (like graphics). This branch of dailygraphics includes test code that the Carebot team has developed to measure 1) how long a dailygraphics embedded project is visible onscreen and 2) how far users have scrolled down the length of a story. Carebot is still a work in progress, and the code we've implemented so far is likely to change.
We have created a CAREBOT_ENABLED configuration option on dailygraphics app_config.py. It allows you to switch Carebot on or off on your graphics. Since carebot-tracker is being served directly by NPR from a CDN you do not need to add any new javascript files to this repo.
CAREBOT_ENABLED is set to True by default on app_config.py, change it to False on your fork to disable Carebot.
If CAREBOT_ENABLED is set to True, new graphics created using the usual fab add[type of graphic]:$slug process will have the latest Carebot code. However, older graphics may need to be retrofitted as needed before being published.
Copy the pymChild analytics code from the onWindowLoaded function of dailygraphics/graphic_templates/graphic/js/graphic.js to the same spot in the js/graphic.js file for your project.
pymChild.onMessage('on-screen', function(bucket) {
    ANALYTICS.trackEvent('on-screen', bucket);
});
pymChild.onMessage('scroll-depth', function(data) {
    ANALYTICS.trackEvent('scroll-depth', data.percent, data.seconds);
});
These are the two custom messages that carebot-tracker will fire on the parent page. If CAREBOT_ENABLED is False this code on your graphic will not be executed.
If you are working with multiple users who are creating/deleting graphics, you may find that you end up with folders for deleted graphics containing only their copytext and other, uncommitted files. If this is bothering you, run:
git clean -dn
This will list folders with no committed files. To permanently delete those folders, run:
git clean -df
NOTE: This will delete any files that have not been committed, so
if you have any work in progress that you do not want deleted, you will
need to commit those files before running git clean -df.
This section is relevant to NPR users of the dailygraphics rig.
The NPR Visuals team recently established a workflow for sending graphics to the NPR copyediting desk, in order to make sure that the information in each graphic is as accurate as possible. This process involves e-mailing a specific set of information to the copyedit desk (this is further expanded on in internal documentation). To help automate compiling and formatting this e-mail, run:
fab copyedit:$SLUG
This will generate an e-mail template with information specific to the graphic that the slug refers to. You can also generate a copyedit note that includes information for multiple graphics:
fab copyedit:$SLUG1,$SLUG2
Alternatively, you can run:
fab copyedit:$SLUG | pbcopy
This will automatically copy the e-mail to your clipboard, which you can then paste into an e-mail service.
The basic templates for these e-mails are generated from the Jinja templates in templates/copyedit/. If you want to further modify these e-mail templates, you should just need to edit the files located there.