Signal plot bug affecting GetLimits() when min/max render index is in use #621
Comments
|
Hi @LB767, I believe |
|
Yes, that is exactly what I expected, but it doesn't work like that. As I mentionned the displayed data changes based on the samplerate value, and with weird behavior, sometimes it doesn't display any data all, as if the min and max ended up on the same index... Edit: I tried it in one of the WPF demos, for instance https://github.com/swharden/ScottPlot/blob/a8292b19c6f4676d97c4e42697b962555613fdcc/src/demo/ScottPlot.Demo.WPF/WpfDemos/PlotInScrollViewer.xaml.cs#L33 |
|
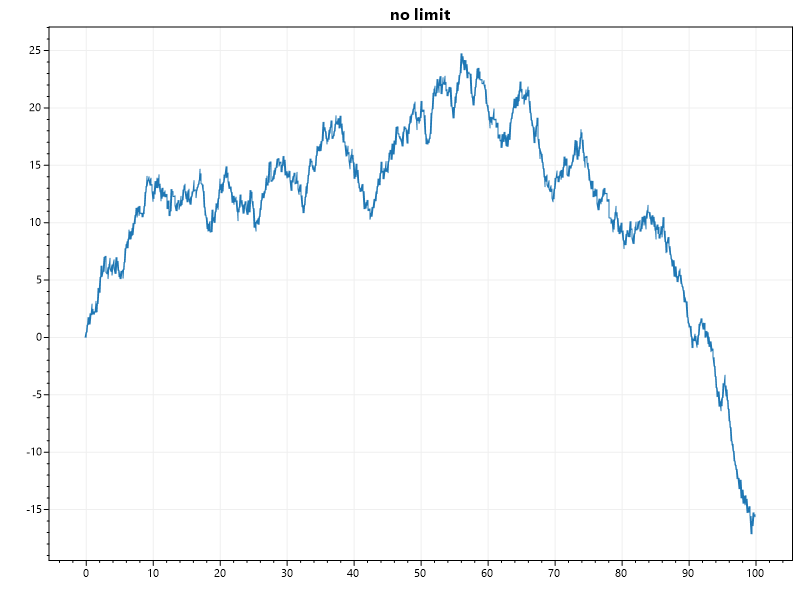
Hey @LB767, I tested this by writing code that plots 1k points with a sample rate of 10 (so 1,000 points spans 0-100 on the horizontal axis). The output renders as I would expect. Can you provide a code sample that produces output different than you'd expect? Perhaps I'm misunderstanding your concern. Random rand = new Random(0);
double[] ys = ScottPlot.DataGen.RandomWalk(rand, 1000);
var plt = new ScottPlot.Plot();
var sig = plt.PlotSignal(ys, sampleRate: 10);
plt.Title("no limit");
plt.SaveFig("1.png");
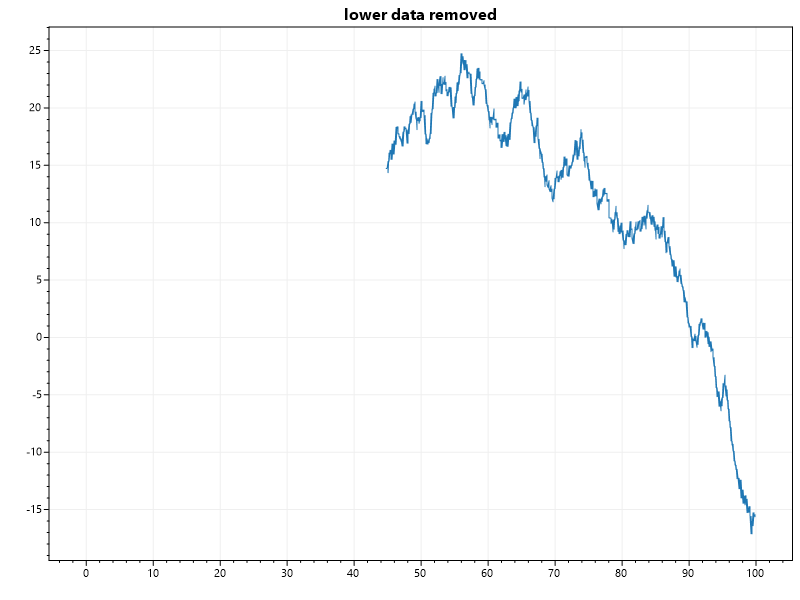
sig.minRenderIndex = 450;
sig.maxRenderIndex = ys.Length - 1;
plt.Title("lower data removed");
plt.SaveFig("2.png");
sig.minRenderIndex = 0;
sig.maxRenderIndex = 550;
plt.Title("upper data removed");
plt.SaveFig("3.png");
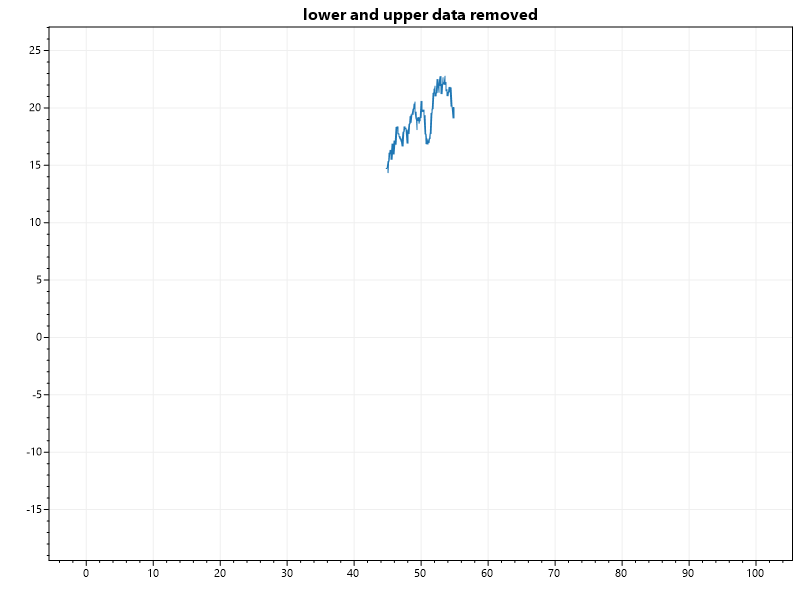
sig.minRenderIndex = 450;
sig.maxRenderIndex = 550;
plt.Title("lower and upper data removed");
plt.SaveFig("4.png");
Hope this helps! |

|
Hey @swharden , thank you for taking the time to try this out on your side. Looks like there's more head-scratching involved than I assumed.... Random rand = new Random(0);
double[] ys = ScottPlot.DataGen.RandomWalk(rand, 1000);
var plt = new ScottPlot.Plot();
var sig = plt.PlotSignal(ys, sampleRate: 10);
plt.SaveFig("1.png");
sig.minRenderIndex = 450;
sig.maxRenderIndex = 550;
plt.Title("lower and upper data removed");
plt.SaveFig("4.png");But this doesn't, and produces a completely empty plot: Random rand = new Random(0);
double[] ys = ScottPlot.DataGen.RandomWalk(rand, 1000);
var plt = new ScottPlot.Plot();
var sig = plt.PlotSignal(ys, sampleRate: 10);
sig.minRenderIndex = 450;
sig.maxRenderIndex = 550;
plt.Title("lower and upper data removed");
plt.SaveFig("4.png");I frankly have no idea what's going on here, it almost seems like it's more to do with the layout of the plot where something might get set when calling Thanks again for your time |
|
I think this a bug related to how automatic axis limits are detected in signal plots with min/max render index specified. I added some code to the end of your example and it seems that the X limits are broken (with the upper limit being a smaller number than the lower limit) Console.WriteLine($"Axis Limits: {new ScottPlot.Config.AxisLimits2D(plt.Axis())}");A quick fix is to call AxisAuto() before setting the min/max render index. I recognize this isn't a great solution though, because middle-clicking in a user control will call AxisAuto() later and the problem will happen again. Random rand = new Random(0);
double[] ys = ScottPlot.DataGen.RandomWalk(rand, 1000);
var plt = new ScottPlot.Plot(400, 300);
var sig = plt.PlotSignal(ys, sampleRate: 10);
plt.AxisAuto(); // set good limits before hiding data
sig.minRenderIndex = 450;
sig.maxRenderIndex = 550;
plt.Title("lower and upper data removed");
plt.SaveFig("4.png");
I think the problem is here: It should probably be limits[0] = _samplePeriod * minRenderIndex + xOffset;
limits[1] = _samplePeriod * maxRenderIndex + xOffset; I'll continue to explore this and issue a fix shortly... |

failing test demonstrating bug described in #621
Addresses the min/max render index problem raised in #621
|
I just published 4.0.44 on NuGet which should have this bug corrected!
|
When using a sampleRate different than 1 in SignalPlot & SignalPlotConst the min and maxRenderIndex properties don't seem to behave properly anymore.
I tried to play with the sampleRate value to see if I could see a pattern that made sense (like min and max being double for a sampleRate of 2 or something) but I couldn't see anything...
Just try
and at least for me this doesn't work
(Using the latest Scottplot 4.0.42 with WPF)
The text was updated successfully, but these errors were encountered: