p.mat matrix not ordered correctly #120
Comments
|
You get even weirder results, when using
|
|
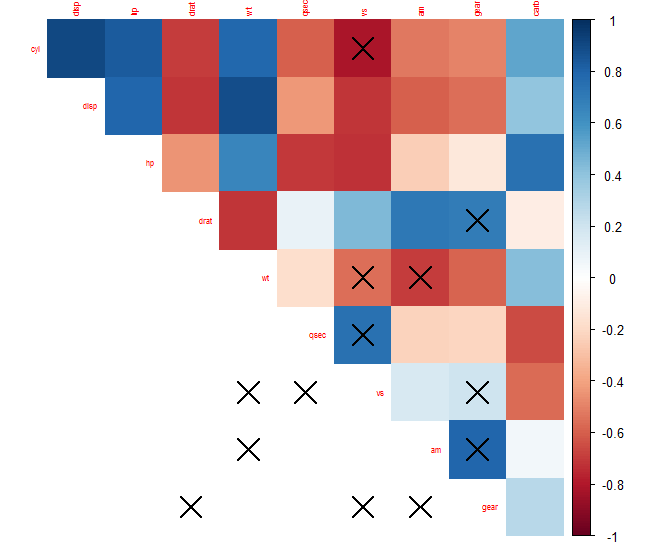
What I've witnessed is that it will put an "X" where the p.value is higher than the significance level, but it will also put X's elsewhere. This is probably the most serious bug in the package, as it actually produces a false result, which means that we can't trust it to draw conclusions, thus rendering the whole package unusable. It's very unfortunate that it's been almost 2 years since this bug has been posted, and since any updates were made to the package, so I'm guessing corrplot is pretty much dead. |
|
The corr and pmat matrix you input are not paired! You SHOULD make them paired first. |
|
The latest version on Github give a warning message when p.mat and corr's rownames, colnames are not same. |
I encountered an issue when plotting with corrplot while using a p-value matrix to mark correlations with high p-values.
It appears, that the p-matrix is not ordered correctly when corrplot orders the correlation coefficient-matrix.
To reproduce the issue, you can use this code:
vs seems to have many correlations with p > 0.01. But looking into the data you'll see this
round(p_mat, 4):The text was updated successfully, but these errors were encountered: