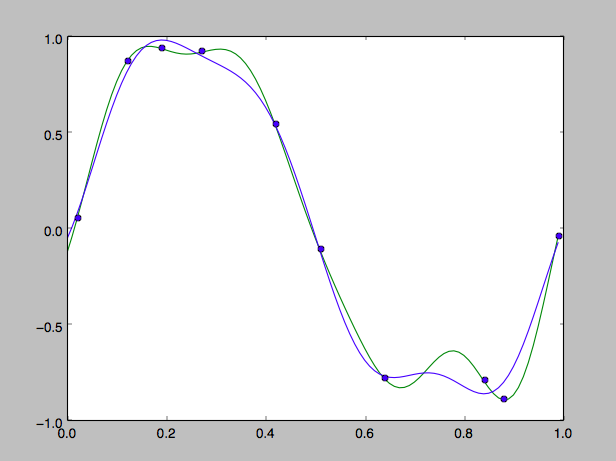
Sample program to model the data by (normal) linear regression and Bayesian lineaer regression. And show the graph to compare those two.
- Python 2.7.6
- Numpy
- Matplotlib
$ python bayesian_lr.py
- Green: Normal linear regression
- Blue: Bayesian linear regression
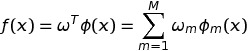
The function is as following in general :
Use the "Gaussian distribution" as the basis function.
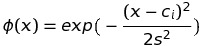
Assuming s = 0.1, c_i = [0.0, 0.1, ..., 1.0].
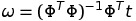
(1) Normal linear regression
These "omega" can be solved by this equation.
(2) Bayesian linear regression
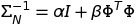
The posterior distribution is expressed as following.

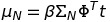
The posterior distribution is Gaussian distribution, so the most possible value is :

So, it is possible to figure out the function by calculating Mu_N.
This time, I assume alpha = 0.1, beta = 9.0.
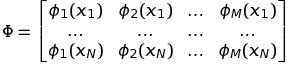
Phi is the matrix as following.
- numpy.linalg.solve : Sove a linear matrix equation. ref. http://docs.scipy.org/doc/numpy/reference/generated/numpy.linalg.solve.html
- numpy.dot : Scalar product, Inner product ref. http://docs.scipy.org/doc/numpy/reference/generated/numpy.dot.html
- numpy.linalg.inv :
- numpy.append :
(in Japanese) http://gihyo.jp/dev/serial/01/machine-learning/0014?page=1