gganimate will show the wrong data for facets when a facet has a different starting year.
In the example below, country #1 has 1900-1940 data and country #2 has 1910-1940 data.
The country1 facet will show "year y data", while country #2 facet will show "year y+10 data.
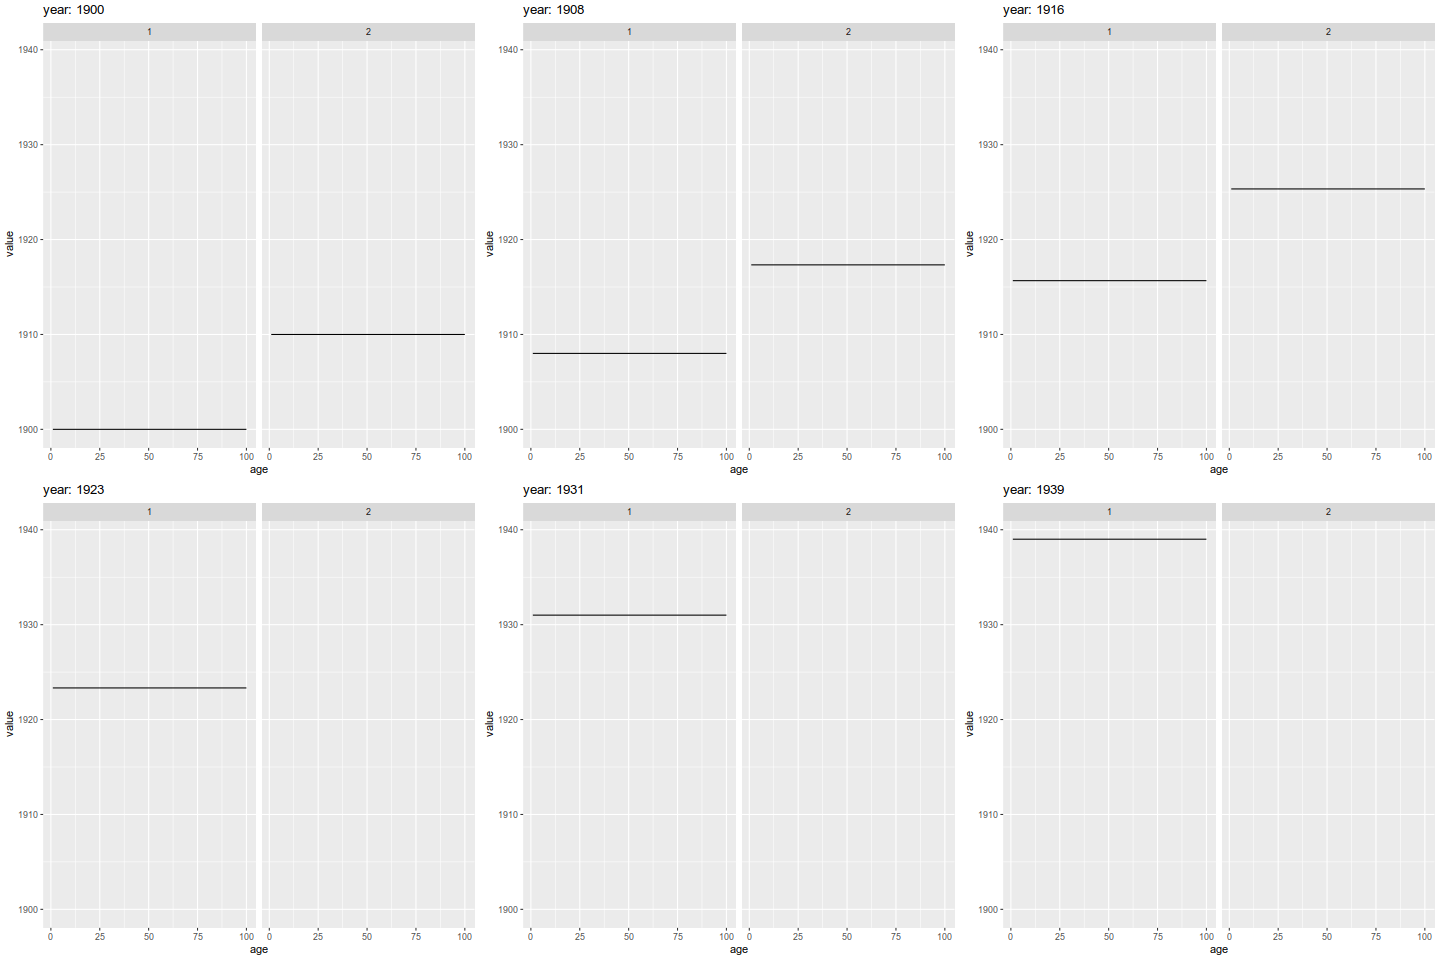
library(tidyverse)
library(gganimate)


country1 <- tibble(year = seq(1900, 1939), country = "1")
country2 <- tibble(year = seq(1910, 1939), country = "2")

ages <- tibble(age = seq(1, 100))

data <- bind_rows(
  country1 %>% crossing(ages),
  country2 %>% crossing(ages)) %>%
  mutate(value = year)

data %>%
  ggplot(aes(x = age, y= value)) +
  geom_line() +
  facet_wrap(~ country) +
  transition_time(year) +
  labs(title = "year: {frame_time}") +
  ease_aes('linear')
gganimate will show the wrong data for facets when a facet has a different starting year.
In the example below, country #1 has 1900-1940 data and country #2 has 1910-1940 data.
The country1 facet will show "year y data", while country #2 facet will show "year y+10 data.