Hi,
Basically, what I'm trying to do is one of the examples shown in the main readme of this repo, however in a different order. The example is:
library(ggplot2)
library(patchwork)

p1 <- ggplot(mtcars) + geom_point(aes(mpg, disp))
p2 <- ggplot(mtcars) + geom_boxplot(aes(gear, disp, group = gear))
p3 <- ggplot(mtcars) + geom_smooth(aes(disp, qsec))
p4 <- ggplot(mtcars) + geom_bar(aes(carb))

p4 +
{
  p1 +
  {
    p2 + p3 + plot_layout(ncol = 1)
  }
} +
plot_layout(ncol = 1)
In my case, I need the p4 to be at the bottom, the rest would be the same (or at least similar enough). I tried as shown below but it returns all plots in a single column (overwriting the previous layout):
{
  p1 +
  {
    p2 + p3 + plot_layout(ncol = 1)
  }
} +
p4 + plot_layout(ncol = 1)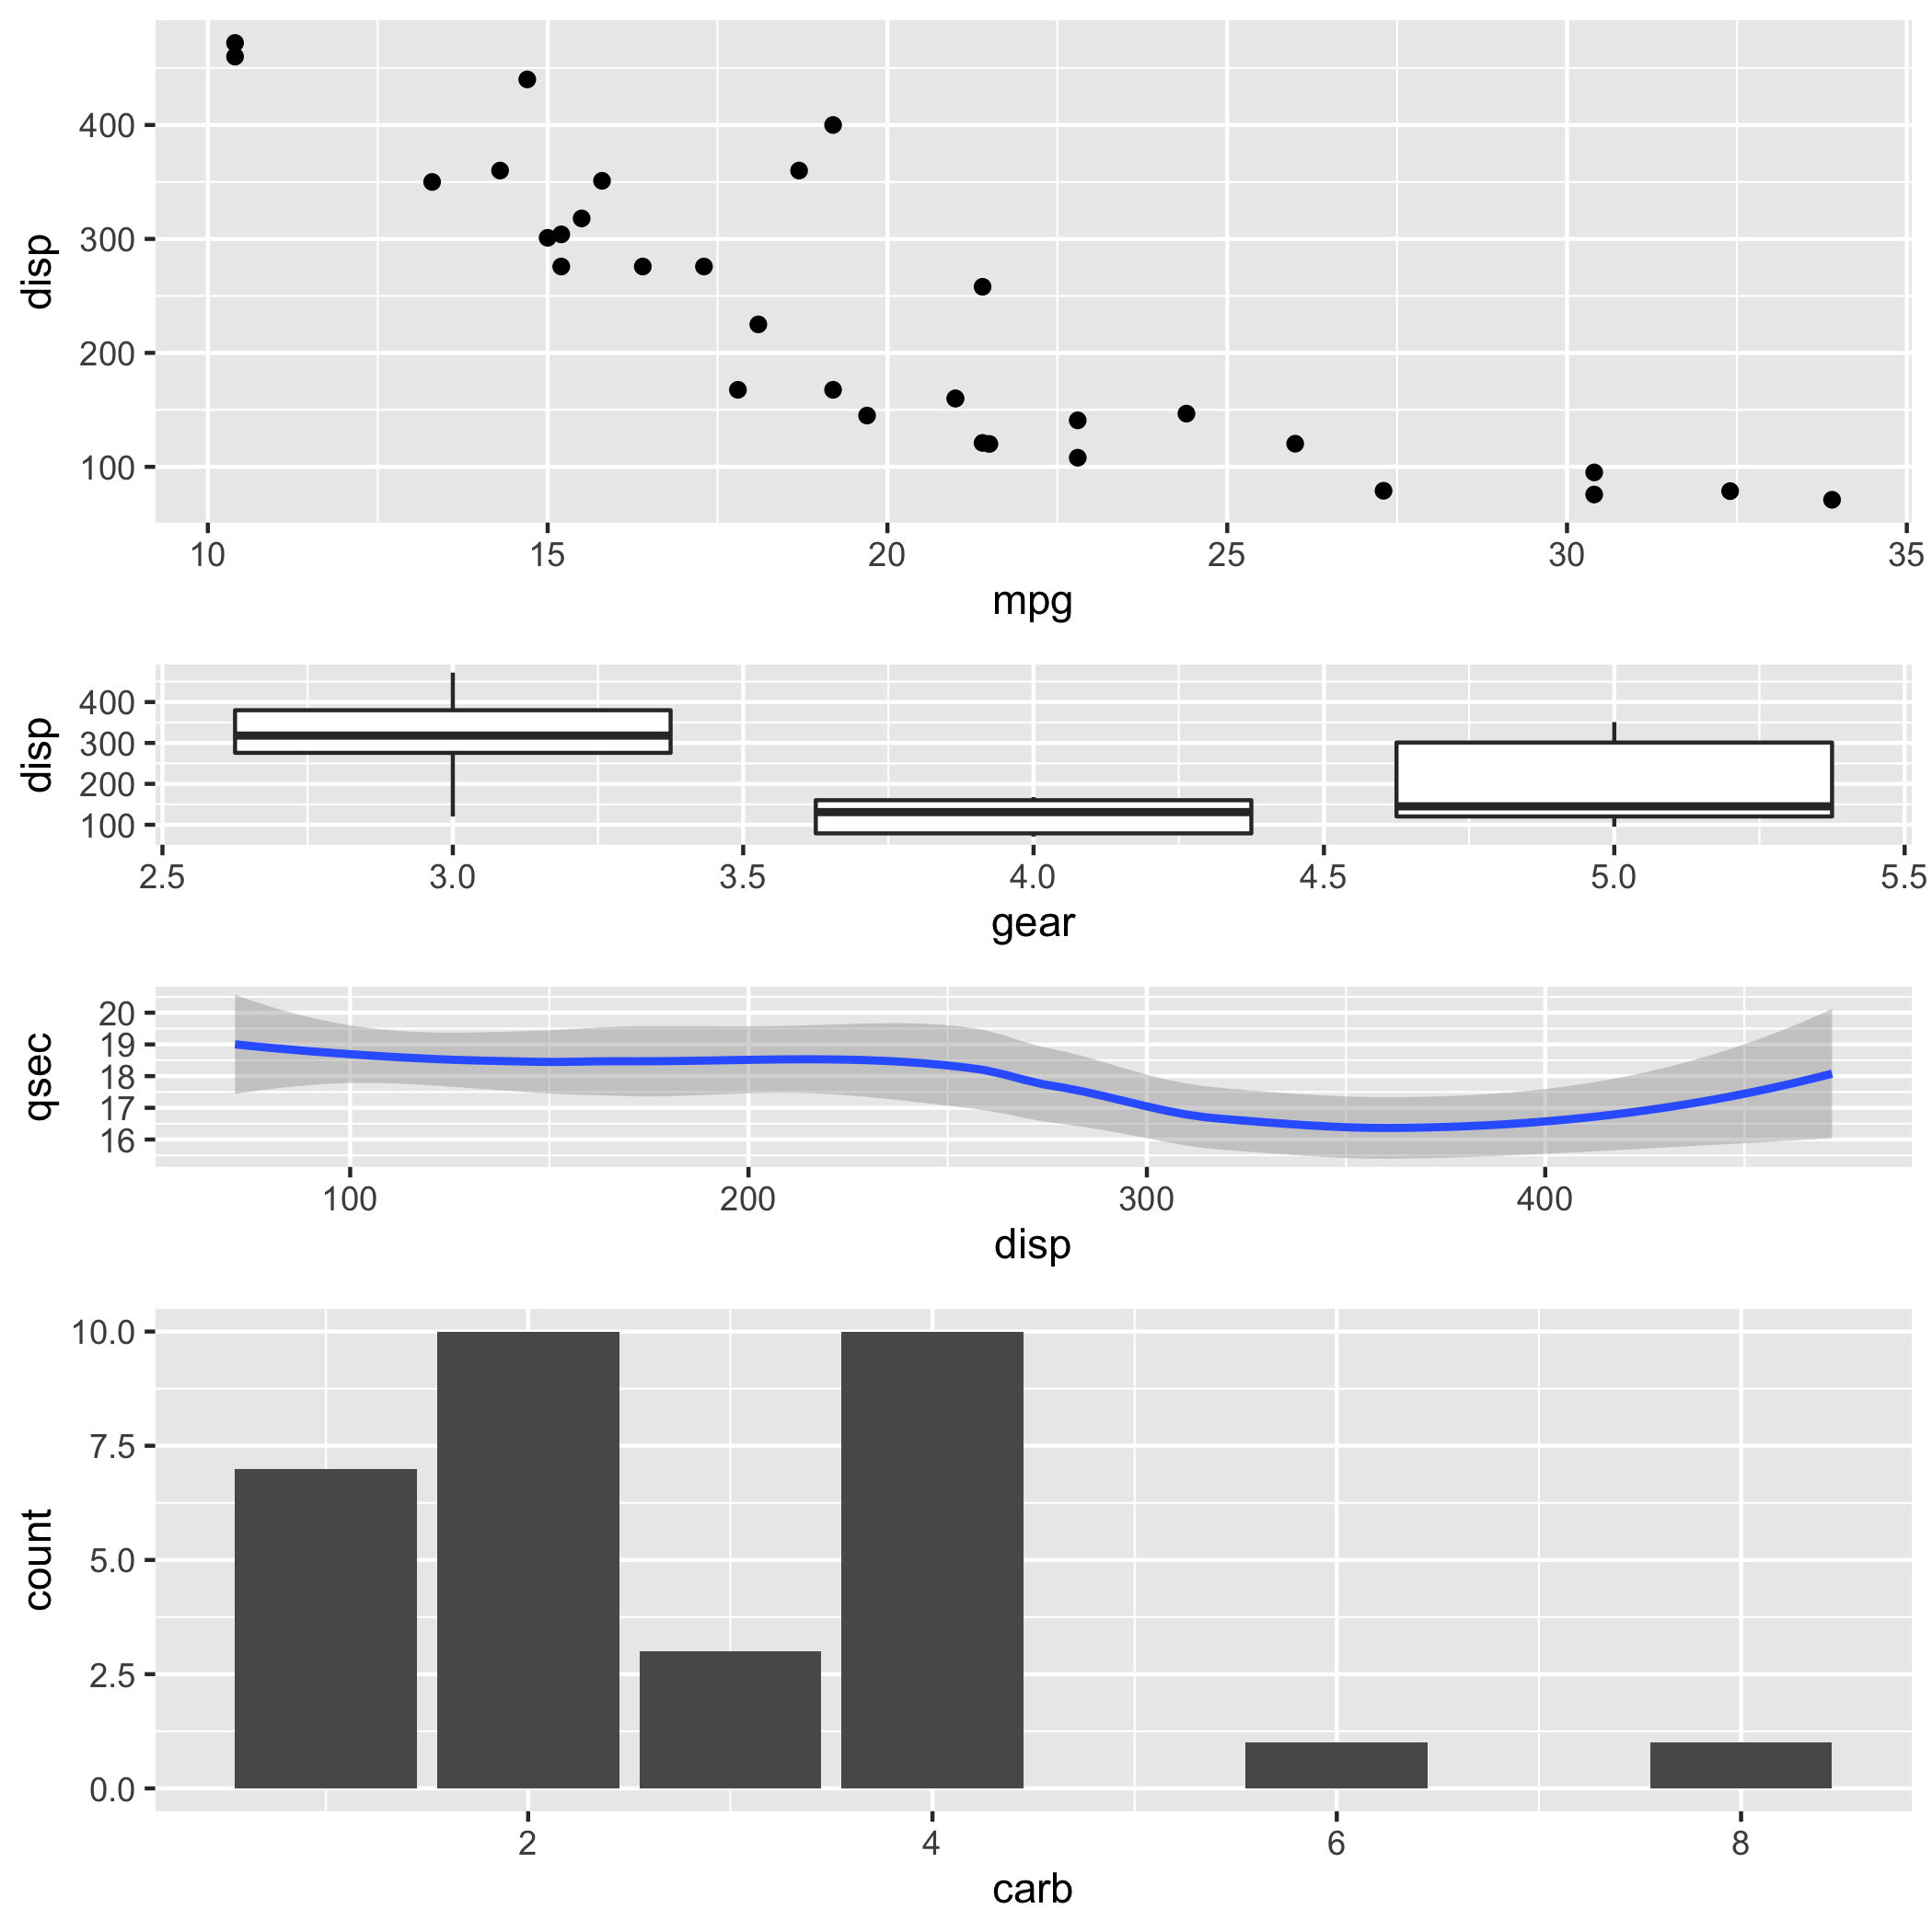
Am I missing something obvious?
Thanks,
Roman
Hi,
Basically, what I'm trying to do is one of the examples shown in the main readme of this repo, however in a different order. The example is:
In my case, I need the
p4to be at the bottom, the rest would be the same (or at least similar enough). I tried as shown below but it returns all plots in a single column (overwriting the previous layout):{ p1 + { p2 + p3 + plot_layout(ncol = 1) } } + p4 + plot_layout(ncol = 1)Am I missing something obvious?
Thanks,
Roman