Community App Performance : Server Calls #1138
Description
The goal of this report is to identify non-essential components that are in between the user and first user interaction.
Browser: Google Canary
URL: https://beta-community-app.topcoder.com/challenges
Audit Tool: Chrome Lighthouse
Lighthouse Audit Profile: Desktop, Simulated Fast 3G, 4x slowdown CPU throttling
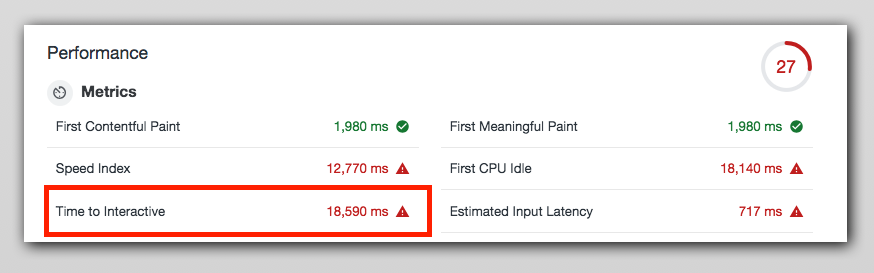
It took more than 18 secs to become page interactive for the logged-in user.
Here is the story by seconds
0 - 1 secs
700ms : DNS query, TCP connection, TLS connection, TCP congestion algo stuff.
Fix : Lot can't be done here but connection reuse with http2 binary/multichannel/stream leverage, using prefetch, dns-prefetch, preload attributes. This will help browser resolve DNS and complete TCP, TLS handshakes eagrly. Most assets required for this page can be fetched like this.
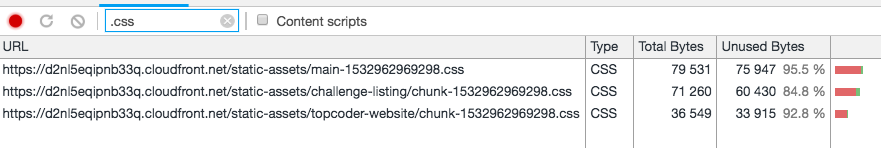
750ms:
CSS requests start, these files are huge and lot of code is unused.
Members profile image call takes 153 ms can be deferred. Loading indicator js is a bootstrap JS and calls main-XXX.js after some time.
Font calls: These are long calls will be taken care by PWA caching, nothing to do here. Font files are hardly changed.
Spinner still on the screen
Fix
- Needs build treeshaking for JS and CSS files
I have seen serious unused bytes of CSS files more than 82% of the payload isn't being used.
More than 50% of JS payload isn't being used

If you want to see what's the cost check out this report which compiles cost of imports of bundles use in community app.
- Use
importwisely here is the VS code plugin to measure it at code level. It can be done at code level but seems like big work. Build time treeshaking should solve this problem. - Use JS treeshaking (topcoder react util)
- Use CSS treeshaking (topcoder react util)
- This can be a preload/prefetch call.
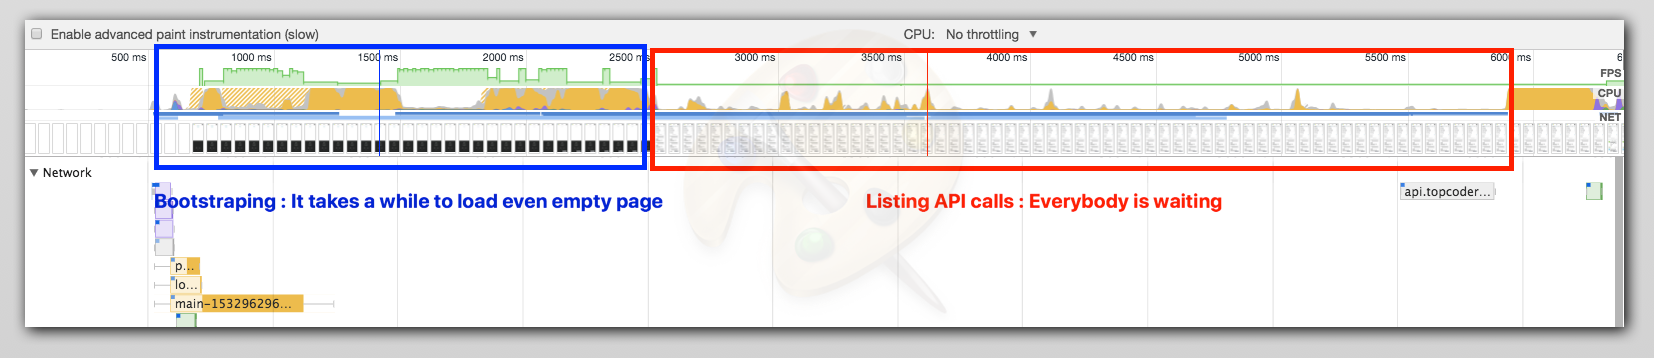
1 - 2 secs
This is mostly the idle phase, nothing much is happening except waterfall calls to vendor libraries.
1000ms: Google analytics JS call, Zendesk. For the first load, they can be deferred and Cache these with stale strategies in PWA
2100ms: Challenge listing js call, where dependency main js and polyfill is already finished loading at 1200ms, there is a huge gap.
Spinner still on the screen
Fix
These calls can be prefetched, we aren't using the Http2 advantage that CDN is offering. Also, these scripts can be preloaded/prefetch. This phase is preceded by huge huge scripting (yellow region)
2 - 18 secs
This is mostly idle phase of the whole report because the way business data API calls are made.
2400ms: First API call
2700ms: Spinner stops and empty app shell is displayed
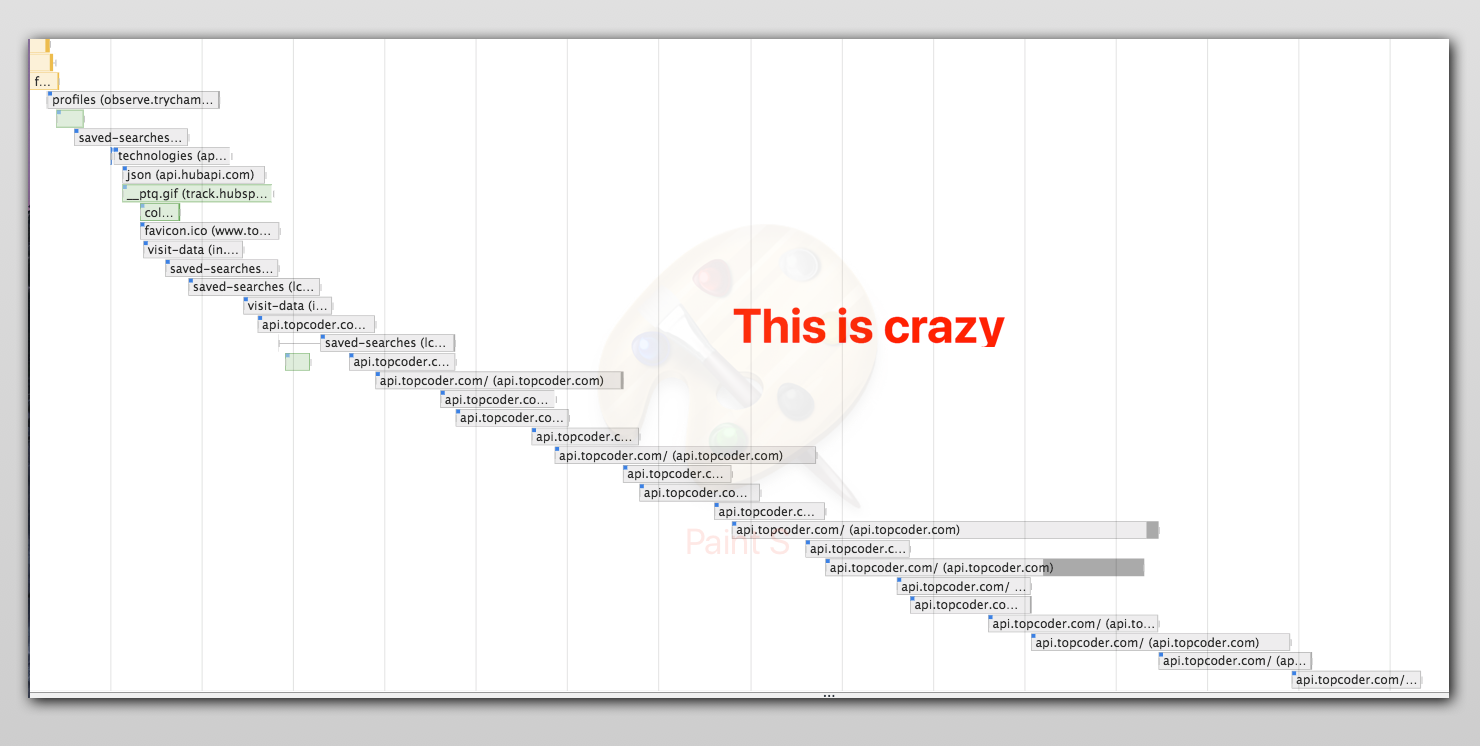
Rest of this phase performs a series of API calls in a waterfall style.
Fix
These calls can be reduced or prefetched as these are fixed URL calls no param values are changed every time they are called. As I see these are http2 calls, they can be prefetched in parallel, the browser will same connection and it will be fast. Here on it take Approx 15000ms to become page interactive as per the report.
Report: Use the above lighthouse profile to generate, it will differ a little but the pattern of problems will be the same.