High CPU usage #2673
Comments
|
Duplicate of #1064? |
|
Can you try with the 1.5.0-rc4 ? |
|
After some investigation, I isolated the piece of code that uses the CPU (by rewriting a simple reverse-proxy). And the culprit is
After some research it seems that this is a known problem and the solution could be to use |

|
I retested with 1.5.0 and got similar cpu metrics. |
|
After migrating from What did you do? What did you expect to see? What did you see instead? Traefik Version: Version: v1.5.3
Codename: cancoillotte
Go version: go1.9.4
Built: 2018-02-27_02:47:04PM
OS/Arch: linux/amd64docker-compose: traefik.toml: If there is anything I can do to help debug, let me know. |

|
I benchmarked haproxy vs traefik 1.5.3 this weekend and concluded that traefik takes quite a bit more CPU. I believe haproxy avoids copying the data to user space (via IO splicing so that the kernel moves data directly from the read buffer to the write buffer). Can someone confirm that Traefik simply does not have this feature yet? Or could there by some general general "high CPU usage" bug in traefik that is worth chasing down? |
|
@juliens any further thoughts on how to proceed here? When in doubt, we should ask users to collect CPU profiles via pprof and analyze the data. My very own experience with benchmarking Traefik taught me that the performance behavior is very dependent on the existing configuration, i.e., which options are set and providers used. |
|
If someone posts some instructions I'd be happy to do some profiling. |
|
In fact, it could be the Here is how to get profiling data:
curl -o profile.pprof <traefik_ip>:8080/debug/pprof/profile    # CPU (takes 30 seconds to return)
curl -o heap.pprof <traefik_ip>:8080/debug/pprof/heap
curl -o block.pprof <traefik_ip>:8080/debug/pprof/block
curl -o mutex.pprof <traefik_ip>:8080/debug/pprof/mutex
curl -o goroutine.pprof <traefik_ip>:8080/debug/pprof/goroutine
curl -o trace.pprof <traefik_ip>:8080/debug/pprof/trace?seconds=5    # the seconds parameter is needed
Thank you for your interest in Træfik. |
|
Done the profiling on a test machine (cloud scaleway VC1S instance 2 core Intel Atom C2750 @ 2.40GHz) with traefik 1.5.3 running on docker (using siege with 50 concurrent users), cpu usage 44% on node with traefik container, only 5% on the node serving the actual content. My docker-compose traefik:
image: traefik:1.5.3-alpine
command:
- "--logLevel=DEBUG"
- "--api"
- "--docker"
- "--docker.swarmmode"
- "--docker.watch"
- "--web"
- "--web.metrics.statsd.address=<STATSD_HOST>"
- "--entrypoints=Name:http Address::80 Redirect.EntryPoint:https"
- "--entrypoints=Name:https Address::443 TLS"
- "--defaultentrypoints=http,https"
- "--acme"
- "--acme.storage=acme.json"
- "--acme.entryPoint=https"
- "--acme.httpChallenge.entryPoint=http"
- "--acme.OnHostRule=true"
- "--acme.email=<MAIL>"
- "--docker"
- "--docker.swarmmode"
- "--docker.domain=<DOMAIN>"
- "--docker.watch"
networks:
- proxy
ports:
- 80:80
- 443:443
volumes:
- /var/run/docker.sock:/var/run/docker.sock |
|
I collected a profile as well. Mine is from the smallest droplet on Digital Ocean (1 cpu, 1 GB RAM). While profiling I ran "wrk -c 6 -t 6 -d 999 ..." on it, causing constant 30% CPU usage in traefik v1.5.3 and 30% in my node webapp. /etc/traefik/traefik.toml: defaultEntryPoints = ["http", "https"]
logLevel = "DEBUG"
[entryPoints]
[entryPoints.http]
address = ":80"
[entryPoints.http.redirect]
entryPoint = "https"
[entryPoints.https]
address = ":443"
[entryPoints.https.tls]
[acme]
entryPoint = "https"
# caServer = "https://acme-staging.api.letsencrypt.org/directory"
storage = "/etc/traefik/acme.json"
email = "martin@minimum.se"
onHostRule = true
[acme.httpChallenge]
entryPoint = "http"
[traefikLog]
# filePath = "/var/log/traefik.log"
[accessLog]
# filePath = "/var/log/traefik-access.log"
[web]
address = "127.0.0.1:8787"
[file]
watch = true
directory = "/etc/traefik/conf.d"And I have one webapp in /etc/traefik/conf.d/foobar.toml [frontends]
[frontends.foobar-frontend]
entryPoints = ["http", "https"]
backend = "foobar-backend"
passHostHeader = true
[frontends.foobar-frontend.routes.default]
rule = "Host:foobar.com"
[backends]
[backends.foobar-backend]
[backends.foobar-backend.servers]
[backends.foobar-backend.servers.server0]
url = "http://127.0.0.1:3000"
[backends.foobar-backend.loadBalancer]
method = "drr"
[backends.foobar-backend.loadBalancer.stickiness]
cookieName = "sticky-session"
[[acme.domains]]
main = "foobar.com"
sans = [] |
|
Similar here. Traefik consumes more CPU than the backend PHP app and almost the same as MySQL. I have observed this behavior since I started using Traefik at 1.3.x, it seems to be even a bit worse at 1.5.4 All static files are hosted by a CDN and the site is not using a full page cache. When I attach strace, most of the output is: Total times: |
|
@juliens Edited my previous post with my configuration |
|
@juliens I have updated my comment above as well |
|
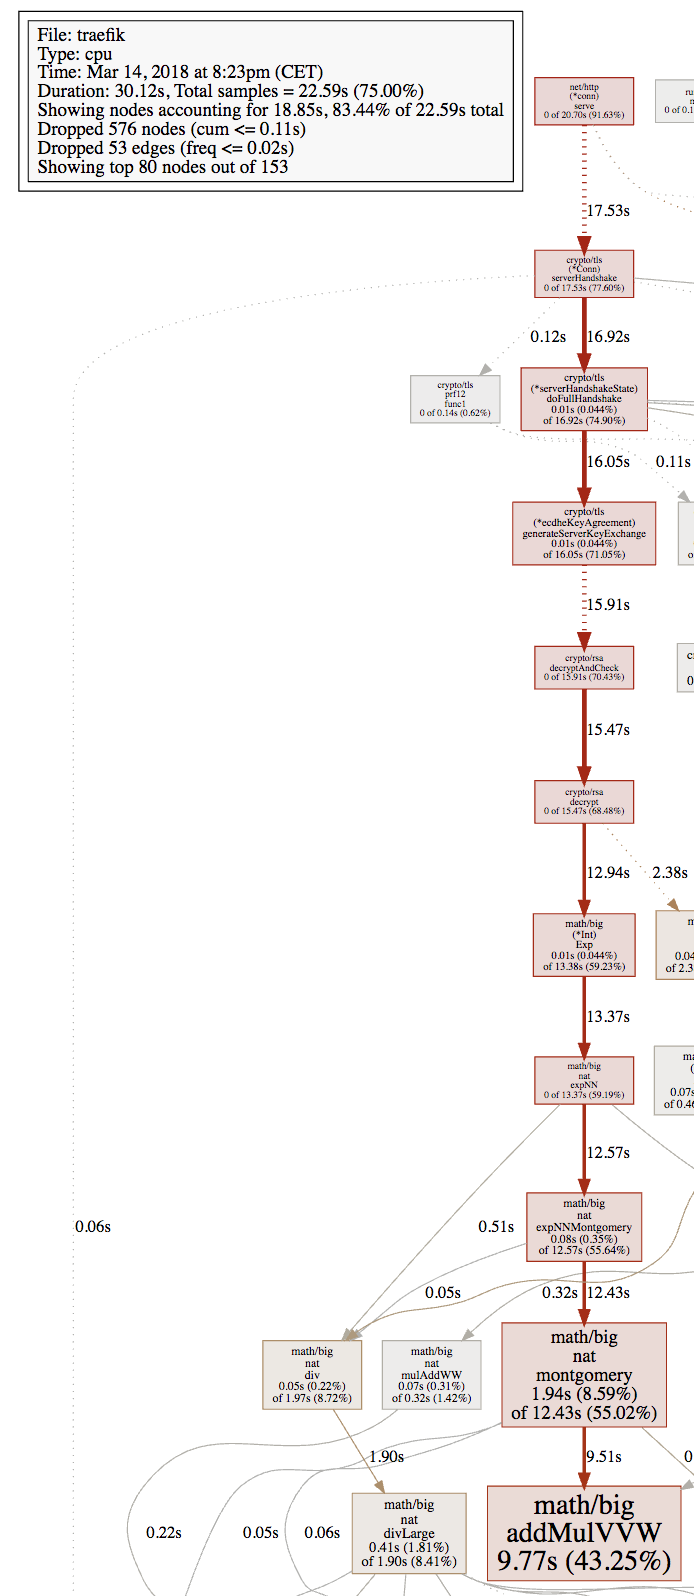
Looking at @GaruGaru's profile, it seems like most CPU cycles (43.25% sample time) are spent inside Go's As a graph:
It's hard for me to tell if those 44% CPU consumption that @GaruGaru reported are reasonable or not. (By the way, is that 44% per core or per entire machine?) It also depends on the request rate that those 50 concurrent users produced. Is there a chance for you to disable TLS to see if it makes a difference? |
|
@timoreimann I built 1.5.4 with your logging fix cherry picked, changed the logLevel to INFO in the config, and re-profiled. I got 40% CPU in node and 30% in traefik (and nothing in systemd this time because the log spam is gone). |
|
Just to add an observation I recently made by accident: I've been load-testing a certain backend application (doesn't matter which one for this) and also noticed very high traefik CPU load. However, switching the API client I've been using to use HTTP keep-alive dropped the CPU load to almost nothing. So it appears that establishing new connections is related to the high load. |
|
Nice find @ulope i repeated the same test with and without keepalive and i've got the following results: With keepalive Without keepalive |
|
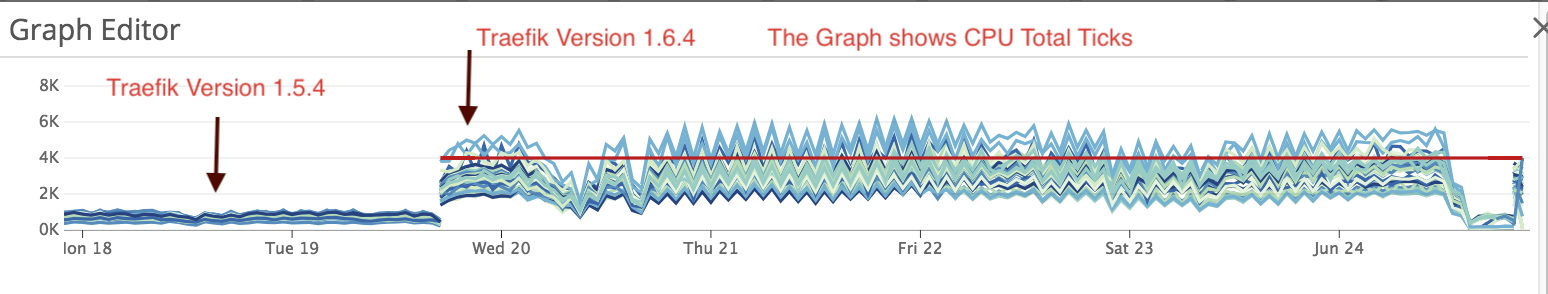
Things have gotten worse in 1.6, I wish you would give more love towards performance soon, because it is not that far away till your space is overtaken by Envoy or some Nginx cloud-native advancements. |
|
We have recently upgraded to Traefik version 1.6.4 and the CPU usage increased dramatically. |
|
@cregev We must have more information to analyze the high CPU reason. Could you give your configuration and do some profiling. Here is how to get profiling data:
curl -o profile.pprof <traefik_ip>:8080/debug/pprof/profile    # CPU (takes 30 seconds to return)
curl -o heap.pprof <traefik_ip>:8080/debug/pprof/heap
curl -o block.pprof <traefik_ip>:8080/debug/pprof/block
curl -o mutex.pprof <traefik_ip>:8080/debug/pprof/mutex
curl -o goroutine.pprof <traefik_ip>:8080/debug/pprof/goroutine
curl -o trace.pprof <traefik_ip>:8080/debug/pprof/trace?seconds=5    # the seconds parameter is needed
Thank you for your interest in Træfik. |
|
traefik_cpu_issue.zip logLevel = "INFO"
debug = true
[accessLog]
format = "json"
[accessLog.filters]
statusCodes = [ "500-520" ]
[api]
entryPoint = "traefik"
dashboard = true
debug = true
[ping]
# Name of the related entry point
#
# Optional
# Default: "traefik"
#
entryPoint = "traefik"
[metrics]
[metrics.datadog]
address = "<Datadog Address>"
pushInterval = "10s"
[consulCatalog]
endpoint = "<Consul Local agent Address>"
constraints = ["tag==http_external_service"]
watch = true
domain = "< customized_domain of similarweb >"
prefix = "traefik" |
|
@cregev Any chance to test with 1.6.3? We suspect a potential cause in 1.6.4. Thanks for your help :) |
|
Is there any update on this topic, we also suffer greatly from this. We use traefik as k8s ingress and after a few days, cpu io-wait spikes up to 90% in our monitoring tools and cripples the whole microservice platform. Tested 1.5.4 and 1.6.6 with similar results. |
|
@Falx Do you have a memory limit set in your pod? The issue could be related to this. I once noticed high CPU usage after certain requests and it simply turned out that there was a lot of pod’s swap IO due to memory limits set my default in the helm chart. problem: #1908 (comment) solution: #1908 (comment) |
Thank you very much for this information. We've updated our memoryLimit in the helm chart to 100Mi and will see in the coming days! |
|
This memory limit in the helm chart is a pretty painful default – your team is not the first one that has been hurt by it. I tried to lobby a change in the chart values a while ago, but no luck to this date. Now, given that the official helm chart is maintained by traefik team directly, feel free to propose a change in the defaults if you agree with me that this is reasonable. IMO the compound time spent on upgrading from chart v1 to v2 is far less than the effort needed to tackle this IO nightmare people randomly enter. It took me a while to figure out why traefik started killing my CPU, I felt desperate during the investigation 😞 |
|
So what exactly is up with the gzip compresssion? Our API serves almost only json (albeit, huge json message with over 20k entries sometimes). Next to that we have some other microservices too that host single page applications with small image assets. Would we benefit from turning gzip compression off? We have a reverse proxy nginx instance in front of the whole k8s cluster (and thus traefik ingress). |
|
The issue is not specific to compression, it’s about resource usage in general. When you have compression, https, high load or any other resource-consuming factor, traefik goes over the default 20MiB ram limit and starts endlessly writing and reading from swap. IMO the problem is that chart defaults are not picked correctly and this causes CPU madness in pretty standard conditions. I was in favor of changing the defaults and thus upgrading the chart to v2, but this proposal has not been accepted. The result is that new traefik chart users fall into the same trap as me a year ago. |
|
Ok I see, so right now we increased the limit to 100Mi, but we will have to monitor if this is enough for our application. I am happy though that at least now we have a logical explanation for this weird behavior we've been seeing. |
|
profile.zip Our issue is migrating from a self implemented gateway, to Traefik. Our own implementation did not use as much CPU in general, but after the upgrade, we have VM average CPU usage around 50%, where we came from 10-20% Avg. Can you help us analyse, since we wanted to move to Traefik for a standard product, but right now our own code is faster (Which I really doubt!). Info: Traefik 1.7.7 Thanks for any pointers! |
You're right, high cpu usage due to slow handshakes with default RSA4096 cert in traefik, check golang issue golang/go#20058 . I change keytype to ECDSA "--acme.keytype=EC256" and cpu usage back to normal. |
|
Does this issue still apply to Traefik 2.0? |
|
Hi @tboerger , the Traefik 2.0 GA version don't have this behaviour as far as we know (reference: #5294 was closed during the RC phase). As this issue is old and hijacked by a lot of different users, we are closing it for triage cleanup. Please feel free to open new issues with reproduction case if you are still having this behavior with latest Traefik v2.0. Thanks! |
Do you want to request a feature or report a bug?
bug
What did you do?
When using traefik in front of dynamic web applications (e.g. nextcloud, speedtest) i see very high cpu usage up to 100%, when data is transferred (e.g. large downloads or speedtests).
Note: traefik and web apps run both in docker swarm
Update 1: disable compression on entrypoint. cpu usage still at 50-60% - is this expected?
What did you expect to see?
no cpu spikes (e.g. like general load balancers / reverse proxies)
What did you see instead?
cpu rises up to 100% cpu load
Output of
traefik version: (What version of Traefik are you using?)What is your environment & configuration (arguments, toml, provider, platform, ...)?
If applicable, please paste the log output in debug mode (
--debugswitch)The text was updated successfully, but these errors were encountered: