Counting Full Length Trinity Transcripts
One metric for evaluating the quality of a transcriptome assembly is to examine the number of transcripts that were assembled that appear to be full-length or nearly full-length. Such an analysis with a reference transcript set, such as from human or mouse, is relatively straightforward, since one can align the assembled transcripts to the reference transcripts and examine the length coverage. For non-model organisms, no such reference transcript set is available. If a high quality annotation exists for a closely related organism, then one might compare the assembled transcripts to that closely related transcriptome to examine full-length coverage. In other cases, a more general analysis to perform is to align the assembled transcripts against all known proteins and to determine the number of unique top matching proteins that align across more than X% of its length.
Trinity supports these analyses using BLAST+.
Useful protein databases to search include:
- SwissProt (ftp://ftp.uniprot.org/pub/databases/uniprot/current_release/knowledgebase/complete/uniprot_sprot.fasta.gz)
- TrEMBL (ftp://ftp.uniprot.org/pub/databases/uniprot/current_release/knowledgebase/complete/uniprot_trembl.fasta.gz).
To examine the extent of top-matching BLAST alignments, first run BLAST, and then run the included analysis script below:
 Build a blastable database:

 %  makeblastdb -in uniprot_sprot.fasta -dbtype prot


 Perform the blast search, reporting only the top alignment:

  % blastx -query Trinity.fasta -db uniprot_sprot.fasta -out blastx.outfmt6 \
        -evalue 1e-20 -num_threads 6 -max_target_seqs 1 -outfmt 6
Type 'blastx -help' for a description of the tab-delimited output format.
Note use of '--max_target_seqs 1', and while this might not report the best match with dna-level searches see Shah 2018, I find it does seem to work as intuited with protein database searches.
If you have an issue with the blast tabular output truncating or otherwise not providing the complete database hit accession, you can try the following: First, include '-parse_seqids' in your 'makeblastdb' command, and then include '-outfmt "6 qaccver sseqid pident length mismatch gapopen qstart qend sstart send evalue bitscore"' in your blastx command.
Next, examine the percent of the target being aligned to by the best matching Trinity transcript, like so:
% $TRINITY_HOME/util/analyze_blastPlus_topHit_coverage.pl blastx.outfmt6 Trinity.fasta uniprot_sprot.fasta
This will create a file called 'blastx.outfmt6.txt.w_pct_hit_length' that adds fields to the blastx output file, including the top hit's length, percent of the hit's length included in the alignment to the Trinity transcript, and the header description for that database entry.
In addition, the distribution of percent length coverage for the top matching database entries is provided as follows.
| hit_pct_cov_bin | count_in_bin | >bin_below |
|---|---|---|
| 100 | 3242 | 3242 |
| 90 | 268 | 3510 |
| 80 | 186 | 3696 |
| 70 | 202 | 3898 |
| 60 | 216 | 4114 |
| 50 | 204 | 4318 |
| 40 | 164 | 4482 |
| 30 | 135 | 4617 |
| 20 | 76 | 4693 |
| 10 | 0 | 4693 |
| 0 | 0 | 4693 |
Only the single best matching Trinity transcript is reported for each top matching database entry; in other words, target database entries are counted uniquely. If a target protein matches multiple Trinity transcripts as their best hits, that target protein is counted only once along with that Trinity transcript that provides the highest BLAST bit score and longest match length.
Statements we can make based on this table include:
- There are 268 proteins that each match a Trinity transcript by >80% and <= 90% of their protein lengths.
- There are 3510 proteins that are represented by nearly full-length transcripts, having >80% alignment coverage.
- There are 3242 proteins that are covered by more than 90% of their protein lengths.
Similar analyses can be performed using nucleotide databases, running blastn instead of blastx.
It is sometimes the case that a single transcript will align to a single protein sequence with several discontinuous alignments (a BLAST hit containing multiple high scoring segment pairs (HSPs)). The approach above will only consider the single best alignment. However, via an extended process below, you can first group those multiple HSPs per transcript and database hit, and compute the alignment coverage based on the grouped HSPs. This extended process begins by using the same BLAST output file: 'blastx.outfmt6'.
   Group the multiple HSPs per transcript/database_match pairing like so:

    % $TRINITY_HOME/util/misc/blast_outfmt6_group_segments.pl \
      blastx.outfmt6  Trinity.fasta  uniprot_sprot.fasta > blastx.outfmt6.grouped


   Then compute the percent coverage by length histogram like so.

    % $TRINITY_HOME/util/misc/blast_outfmt6_group_segments.tophit_coverage.pl blastx.outfmt6.grouped
The resulting table has an identical format to as described above, but is now based on grouped HSPs per transcript/database_match pair as opposed to a single HSP per pairing.
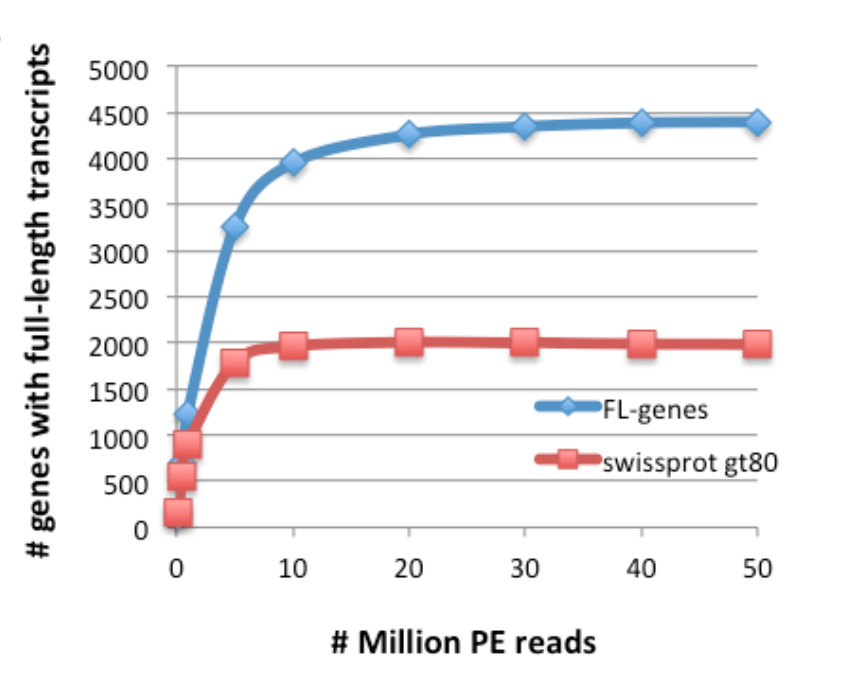
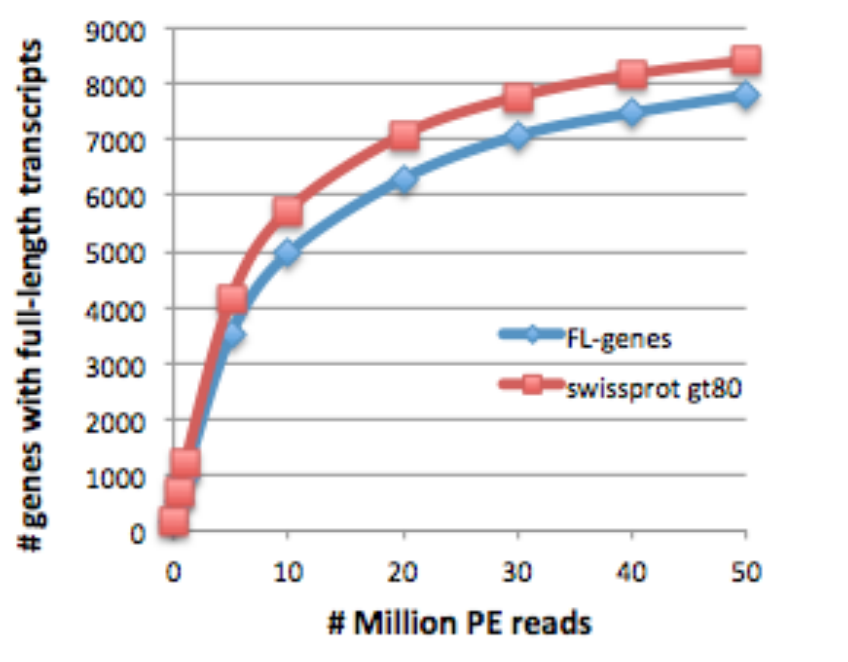
If you generate assemblies at a range of different read depths up to and including your assembly leveraging all available reads (of course, include Trinity --normalize reads here as appropriate and use identical parameters for each of your assemblies), you can perform this full-length transcript analysis separately for each of your assemblies, and then plot the number of full-length transcripts vs. number of input RNA-Seq fragments. If you've sequenced sufficiently deep enough, the number of full-length transcripts obtained should be saturating. If you find that you're continuing to obtain substantial numbers of newly represented full-length transcripts, then you would be expected to continue to obtain a better assembly by having sequenced and assembled even more reads.
Example plots are below for S. pombe:
and mouse:
Both plots are provided in the supplementary materials to our Nature Protocols paper http://www.nature.com/nprot/journal/v8/n8/full/nprot.2013.084.html
- Estimate the number of missing genes and estimate additional sequencing required for improved gene representation via the h6 statistic: "How Many Genes Are Expressed in a Transcriptome? Estimation and Results for RNA-Seq." PLoS One. 2015 Jun 24;10(6):e0130262.