


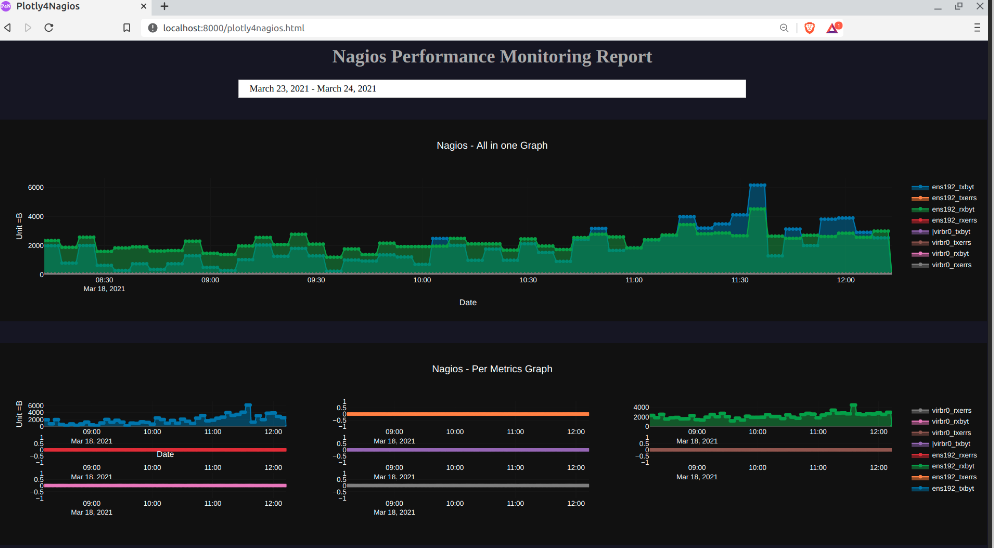
Plotly4Nagios is a nagios plugin to display the performance data in Graph. It uses the RRD database provided by pnp4nagios and visualize it in interactive graph format using plotly javascript. You can experiment it and report the issue/feedback for further enhancement.
Plotly4Nagios is accepted and listed under official nagios addons
- Easy integration with nagios
notes_url. - Single page view for all performance metrics.
- Easy template change using configuration variable.
- Docker container based deploy and run.
- Download plotly4nagios.tar.gz and extract it under /usr/local/plotly4nagios
- Modify the config.json variables according to the environment
- Copy the plotly4nagios/plotly4nagios.conf to /etc/http/conf.d/ folder and restart httpd
- Add the follwing with notes_url to templates.cfg.
    notes_url /plotly4nagios/plotly4nagios.html?host=\$HOSTNAME\$&srv=_HOST_
notes_url /plotly4nagios/plotly4nagios.html?host=\$HOSTNAME$&srv=\$SERVICEDESC$- Restart httpd and nagios.
- Build the docker image using the below command
git clone https://github.com/vigneshragupathy/plotly4nagios.git
cd plotly4nagios
docker build -t plotly4nagios .- Run the docker container using the below command
docker run -it --name plotly4nagios -p 80:80 plotly4nagiosAlternatively direct pull and run from docker hub.
docker run -d -p 80:80 --name plotly4nagios vigneshragupathy/plotly4nagiosOpen from the browser and view the application at http://localhost/nagios
- Username : nagiosadmin
- Password : nagios
Copyright 2020-2021 © Vignesh Ragupathy. All rights reserved.
Licensed under the MIT License