Elastic Architecture
Please note! This wiki is no longer maintained. Our documentation has moved to https://securityonion.net/docs/. Please update your bookmarks. You can find the latest version of this page at: https://securityonion.net/docs/Elastic-Architecture.
Below are several diagrams to represent the current architecture and deployment scenarios for Security Onion on the Elastic Stack.
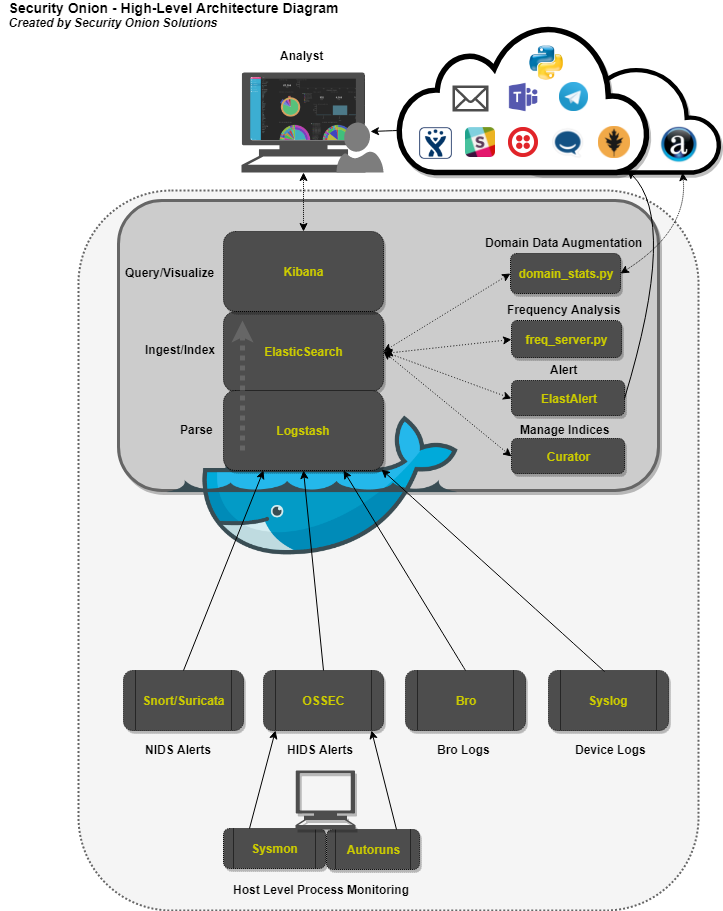
Logstash - Parse and format logs.
Elasticsearch - Ingest and index logs.
Kibana - Visualize ingested log data.
Curator - Manage indices through scheduled maintenance.
ElastAlert - Query Elasticsearch and alert on user-defined anomalous behavior or other interesting bits of information.
FreqServer -Detect DGAs and find random file names, script names, process names, service names, workstation names, TLS certificate subjects and issuer subjects, etc.
DomainStats - Get additional info about a domain by providing additional context, such as creation time, age, reputation, etc.
(click for larger version)
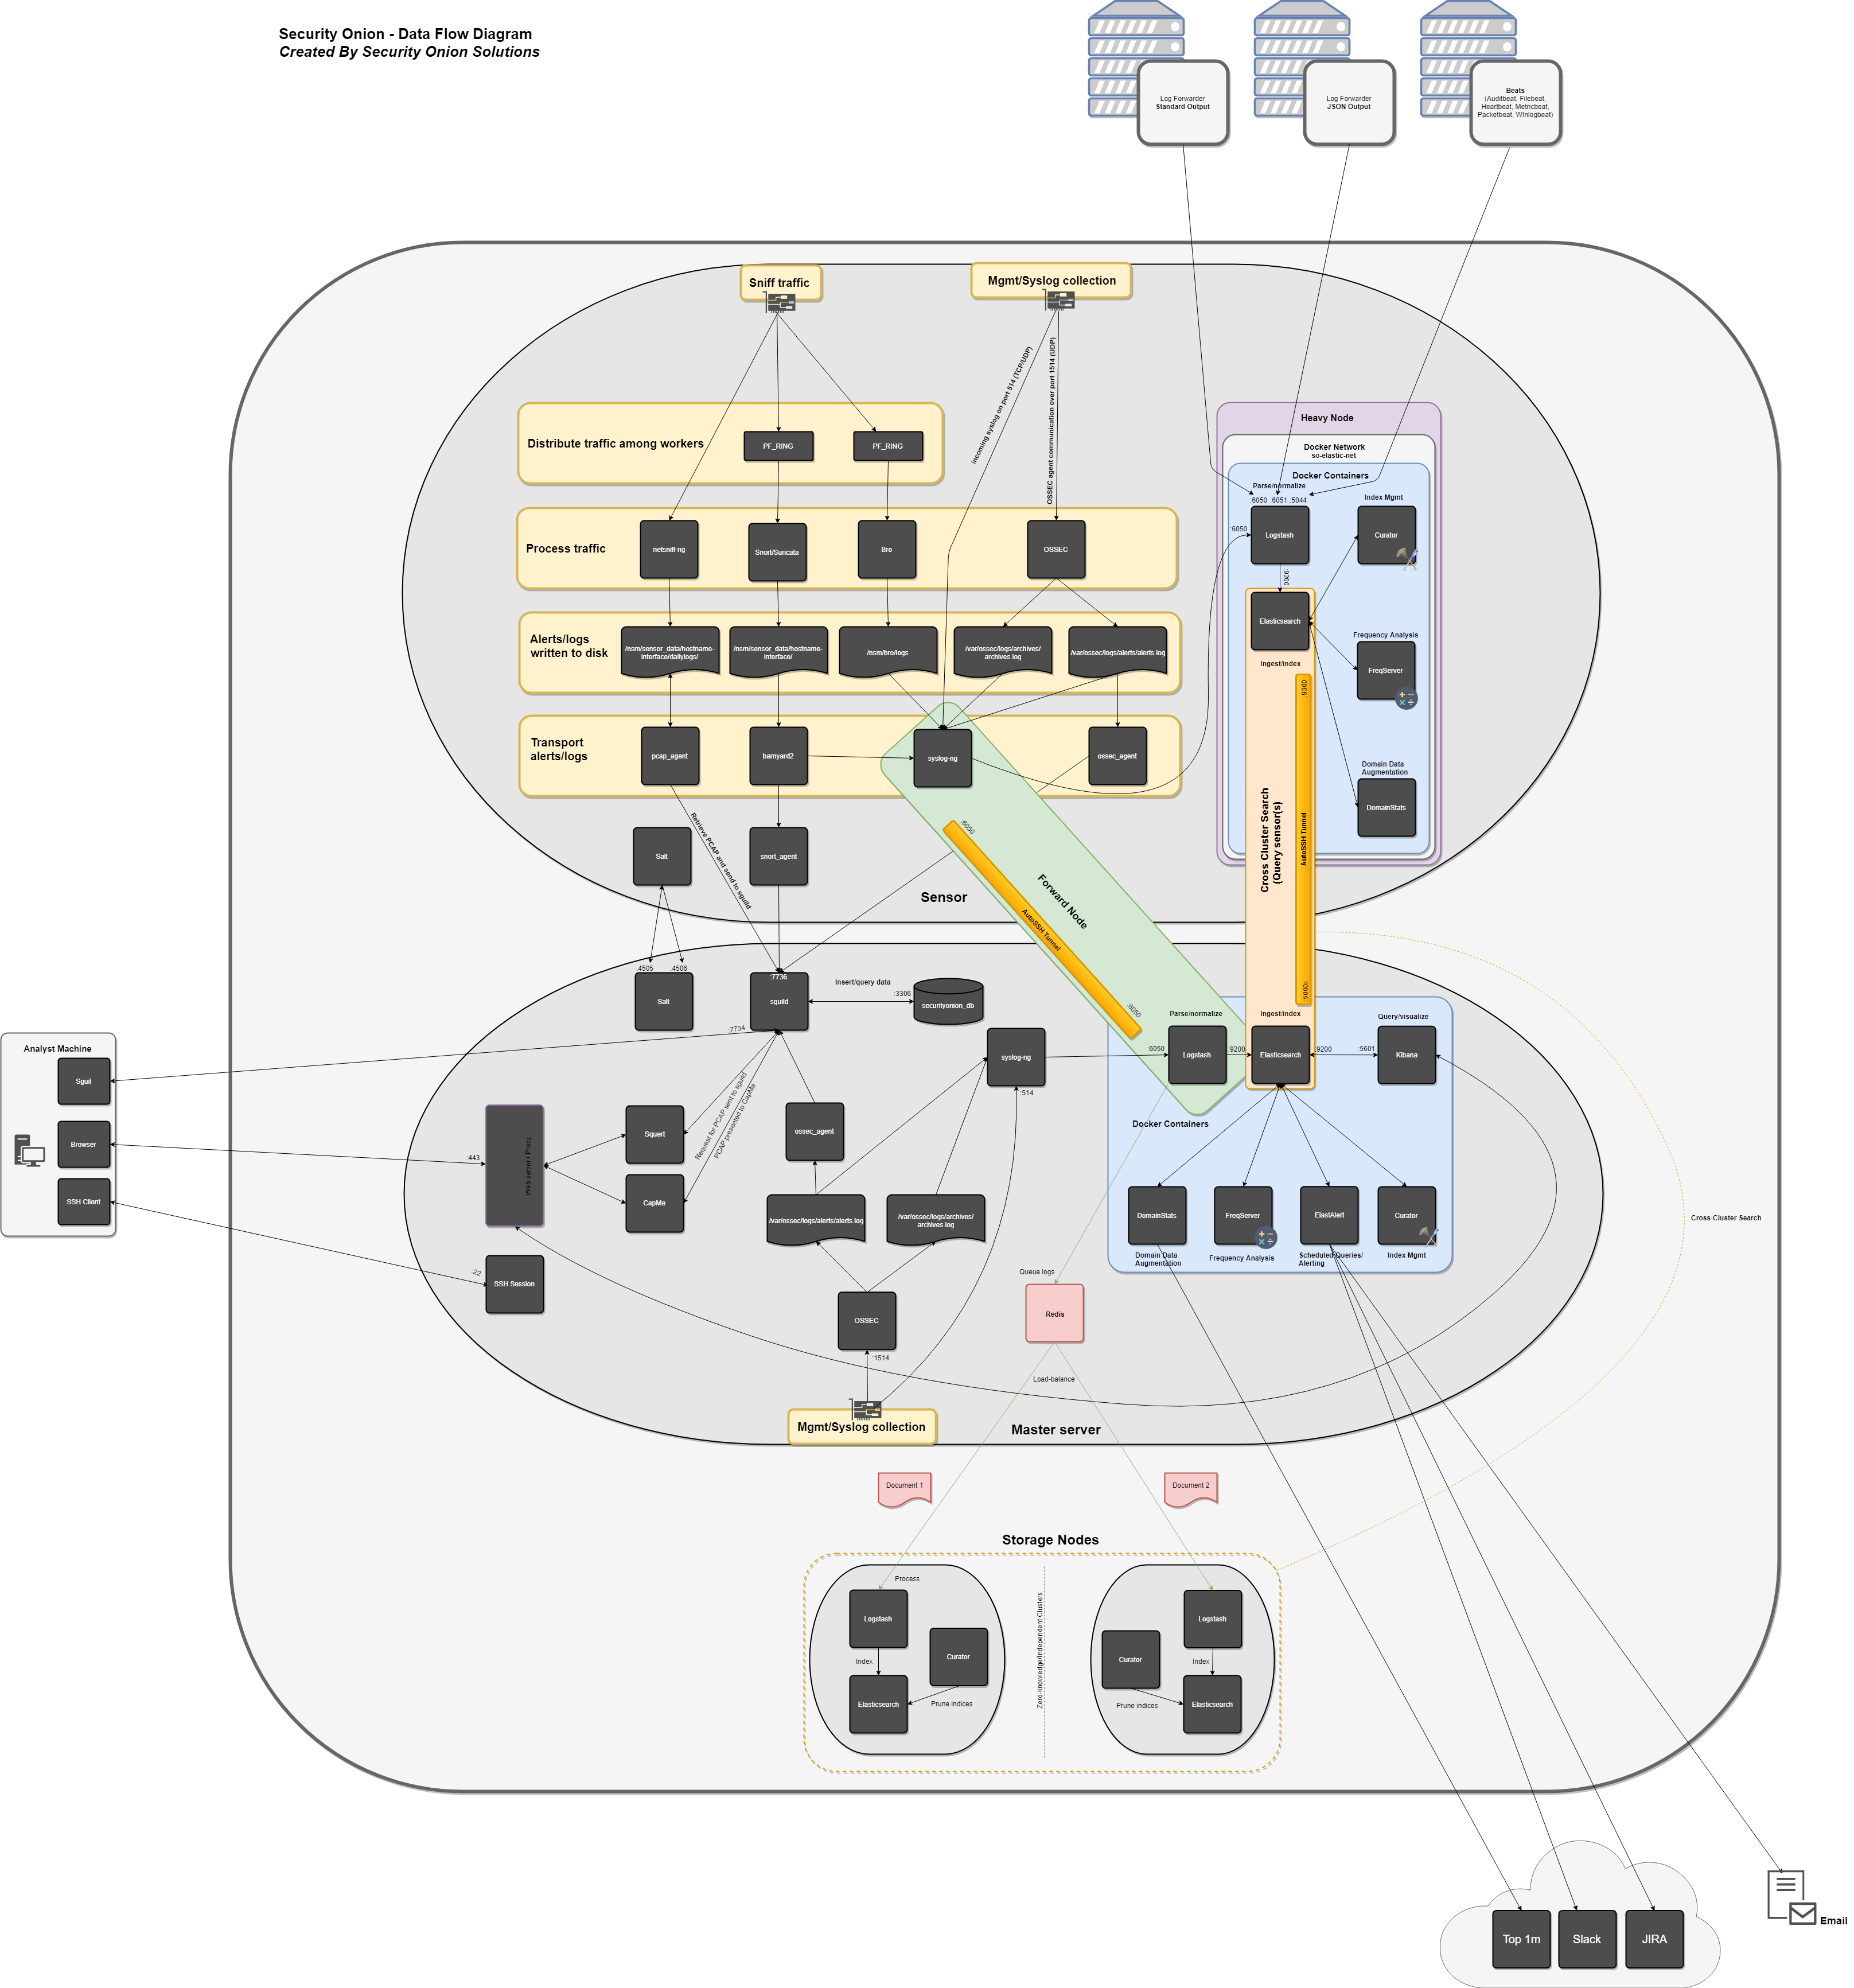
Security Onion is built on a modified distributed client-server model. In the past, Security Onion relied solely on the use of a “sensor” (the client) and a Security Onion “server” (the server). With the inclusion of the Elastic Stack, the distributed architecture has since changed, and now includes the use of Elastic components and separate nodes for processing and storing Elastic stack data.
This means that a standard distributed deployment is now comprised of the master server, one or more forward nodes (previously called a sensor -- runs sensor components), and one or more storage nodes (runs Elastic components). This architecture is ideal; while it may cost more upfront, this architecture provides for greater scalability and performance down the line, as one can simply "snap in" new storage nodes to handle more traffic or log sources.
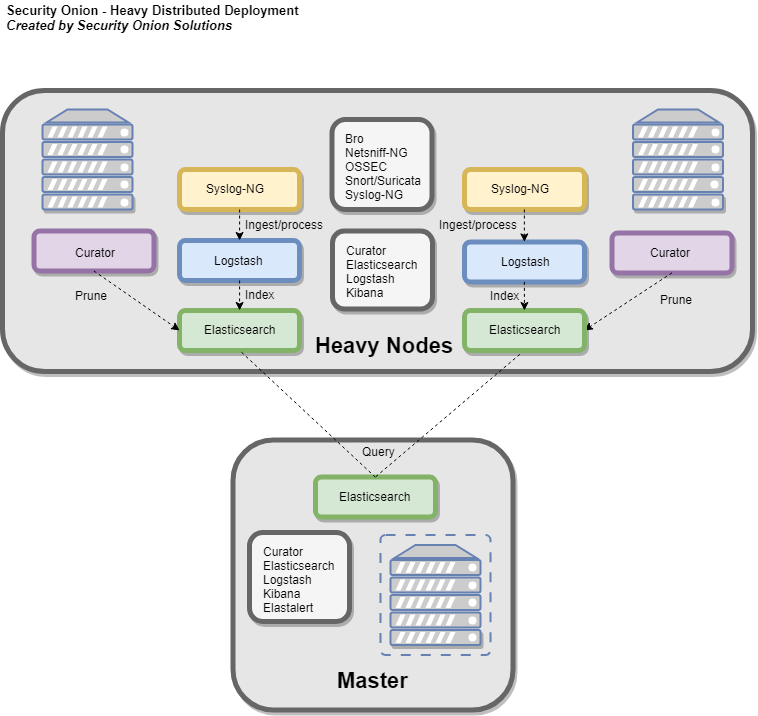
There is the option to utilize only two node types -- the master server and one or more heavy nodes, however, this is not recommended due to performance reasons, and should only be used for testing purposes or in low-throughput environments.
Last, similar to before, users can run a standalone, which combines the functions of a master server, forward node, and storage node. The same caveats with performance apply here. This type of deployment is typically used for testing, labs, POCs, or very low-throughput environments.
More detail about each deployment and node type can be found below.
- Recommended deployment type
- Consists of a master server, one or more forward nodes, and one or more storage nodes.

- Recommended only if a standard distributed deployment is not possible.
- Consists of a master server, and one or more heavy nodes.
- Not recommended for monitoring high-throughput links
- Consists of a single server running master server components, sensor, and Elastic stack components.

The master server runs it's own local copy of Elasticsearch, which manages cross-cluster search configuration for the deployment. This includes configuration for heavy nodes and storage nodes (where applicable), but not forward nodes, as they do not run Elastic Stack components. An analyst connects to the server from a client workstation (typically a Security Onion virtual machine installation) to execute queries and retrieve data.
The Master Server runs the following components (Production Mode w/ Best Practices):
- Elasticsearch
- Logstash
- Kibana
- Curator
- Elastalert
- Redis (Only if configured to output to a storage node)
- OSSEC
- Sguild
When using a forward node, Elastic Stack components are not installed. Syslog-NG forwards all logs to Logstash on the master server via an autossh tunnel, where they are stored in Elasticsearch on the master server, or forwarded to storage node's Elasticsearch instance (if the master server has been configured to use a storage node). From there, the data can be queried through the use of cross-cluster search.
Forward Nodes run the following components (Production Mode w/ Best Practices):
- Bro
- Snort/Suricata
- Netsniff-NG
- OSSEC
- Syslog-NG
When using a heavy node, Security Onion implements distributed deployments using Elasticsearch's cross cluster search. When you run Setup and choose Heavy Node, it will create a local Elasticsearch instance and then configure the master server to query that instance (similar to ELSA distributed deployments). This is done by constructing an autossh tunnel from the heavy node to the master server, configuring reverse port forwarding to allow the master server to connect to the local Elasticsearch instance, and updating _cluster/settings on the master server so that it will query the local Elasticsearch instance.
- Elasticsearch
- Logstash
- Curator
- Bro
- Snort/Suricata
- Netsniff-NG
- OSSEC
- Syslog-NG (forwards logs locally to Logstash)
Storage nodes extend the storage and processing capabilities of the master server. Just like heavy nodes, storage nodes are added to the master's cluster search configuration, so the data that resides on the nodes can be queried from the master.
Storage Nodes run the following components (Production Mode w/ Best Practices):
- Elasticsearch
- Logstash
- Curator
- OSSEC