This is an extension to help with WebGPU development
The latest published version is available here:
- Chrome
- [Firefox (TBD)]
- [Safari (TBD)]
Otherwise you can install top of tree locally by downloading or cloning this repo and then adding it as a developer. For example in Chrome
- go to
about://extensions - enable developer mode
- pick "Load Unpacked"
- Select the "extension" folder from this repo
Pick an option then refresh the page.
This injects the webgpu-debug-helper.
The WebGPU Debug Helper shows errors (see next option). It also throws on encoder errors.
Normally GPUCommandEncoder, GPURenderPassEncoder, GPUComputePassEncoder and
GPURenderBundleEncoder do not emit errors. Instead, they just record the first error
and then you don't actually get the error until you end the pass and finish the
encoder. With this option checked, most of the encoder errors will throw a JavaScript
error immediately.
What is the point of this option vs the next (show error)? Show error is a small script
that only checks functions on GPUDevice and GPUQueue as those are the only objects
that actually emit errors in WebGPU.
WebGPU Debug Helper is a very large script. It might be buggy so I've kept both options so if you find a bug you can try to use the less capable but simpler "Show Errors" option. Of course if you do find a bug, please create an issue and with a repo.
This has 3 points
-
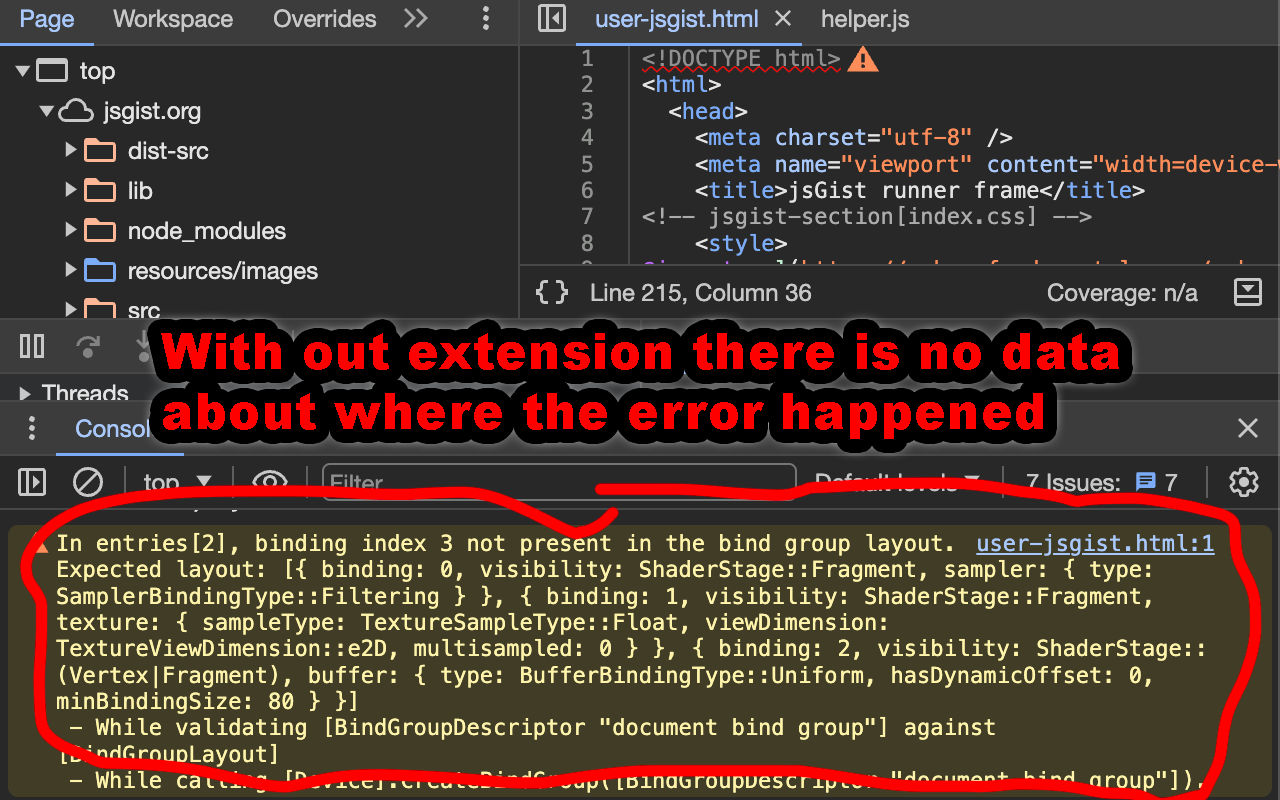
A WebGPU app can suppress errors by capturing them with
pushErrorScopeandpopErrorScopeas well as adding anuncapturederrorlistener to the device. Turning on this feature still prints the errors to the JavaScript console, even when they are captured. -
WebGPU errors happen asynchronously and so often do not provide info where the error happened. This is an attempt to add that info for some (but not all) errors.
-
The parameters of the function that caused the error are not always available. This is an attempt to include those parameters.

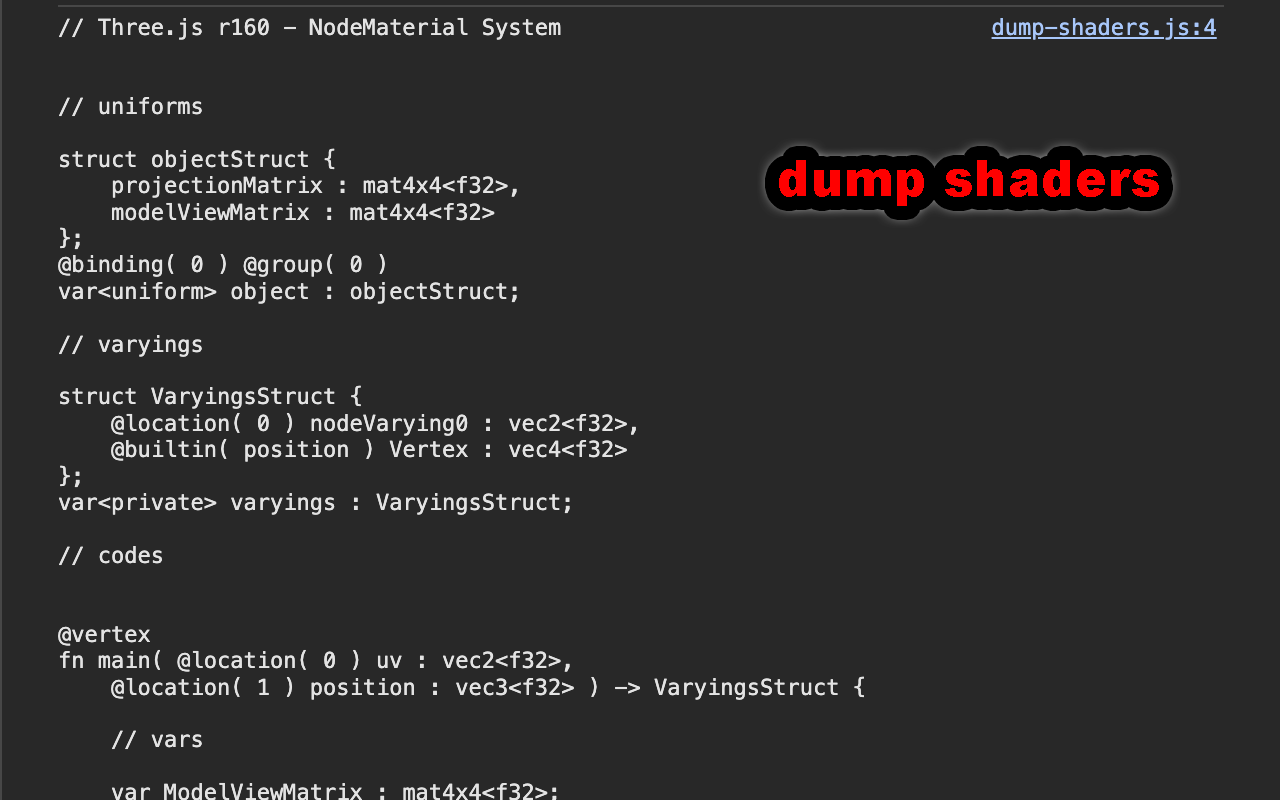
If a shader module gets an error, shows the entire shader in the JS console.
Normally shader errors only show the line the error happened on.
Uses the webgpu-memory library to show how much WebGPU memory is in use
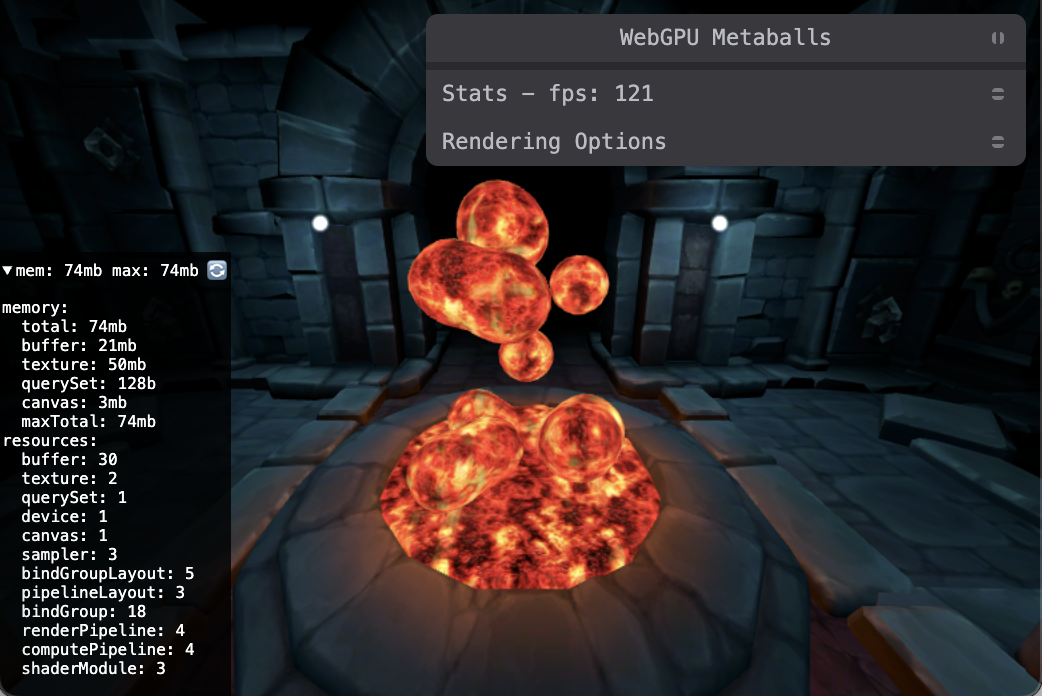
The "max" is maximum amount of memory that was used since the last click on 🔄.
This open shows the amount of redundant state set per frame. It uses the webgpu-avoid-redundant-state-setting library.
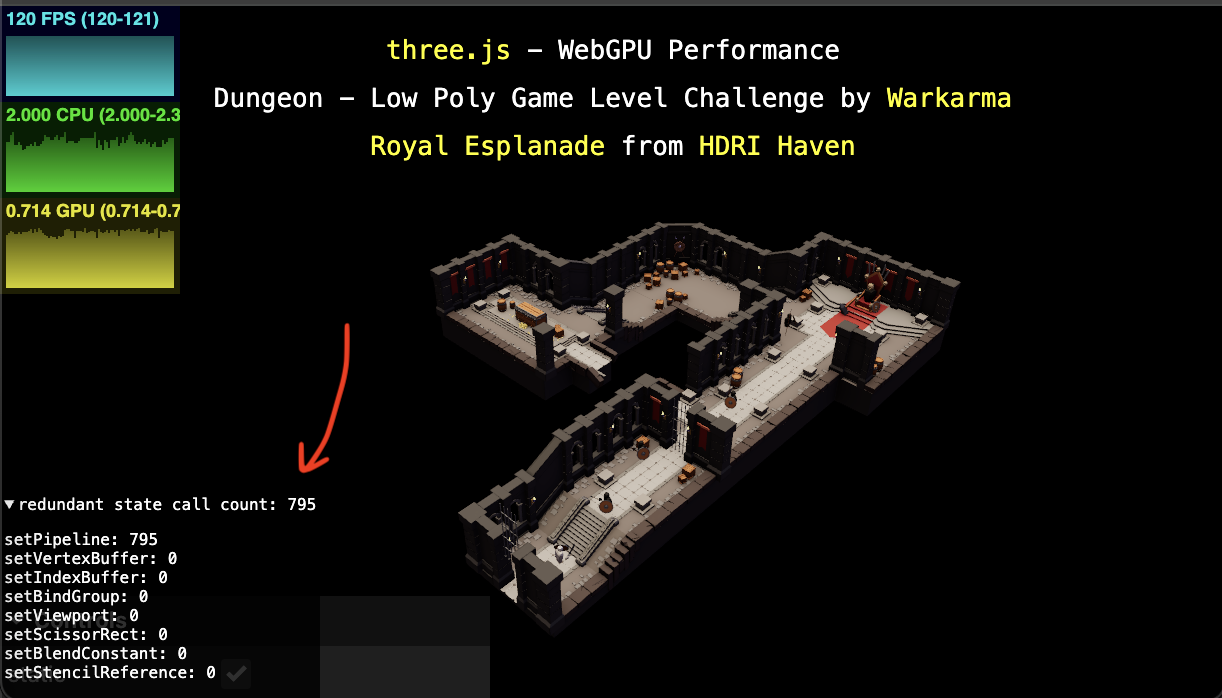
Note: The library actually stops your app from setting redundant state so in affect it's proof the state didn't need to be set.
An example of setting redundant state. Imagine you draw a bunch of object in a loop
{
  const pass = encoder.beginRenderPass(...);
  for (const obj of objects) {
    pass.setPipeline(obj.pipeline);
    pass.setBindGroup(0, obj.bindGroup0);
    pass.setVertexBuffer(0, obj.vertexBuffer0);
    pass.draw(obj.vertexCount);
  }
  pass.end();
}
If obj.pipeline is the same for all objects then you only needed to
call setPipeline once and the redundant state count setting will be > 0.
Note: Having a count > 0 is NOT a cardinal sin. That said, if your number is in the 100s or 1000s then there is probably a measurable amount of at least JavaScript perf to be had from skipping setting the state 100s of extra times per frame.
Given the above code, a simple example might be
{
  let lastPipeline;
  const pass = encoder.beginRenderPass(...);
  for (const obj of objects) {
    // don't set the pipeline if it's the same one.
    if (lastPipeline !== obj.pipeline) {
      lastPipeline = obj.pipeline;
      pass.setPipeline(obj.pipeline);
    }
    pass.setBindGroup(0, obj.bindGroup0);
    pass.setVertexBuffer(0, obj.vertexBuffer0);
    pass.draw(obj.vertexCount);
  }
  pass.end();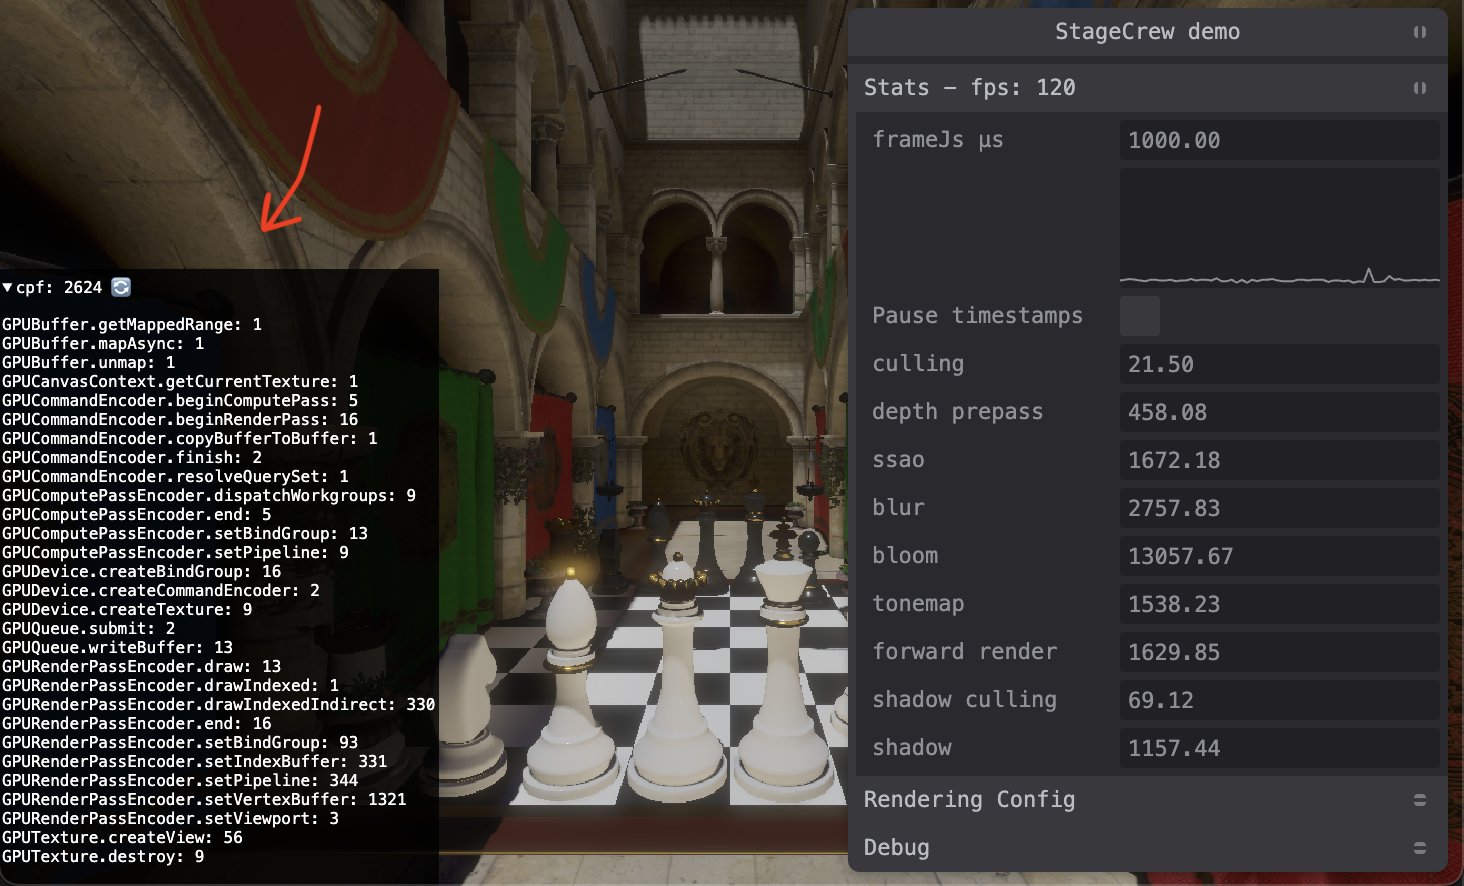
}Shows the number of WebGPU calls per requestAnimationFrame.
This can be useful to see if the numbers match your expectations.
Like maybe you expected you were not creating any bindGroups but
you see there are 16 call per frame to createBindGroup.
Call counts of 0 are kept in the list until you click 🔄 so that the list does not jumble around.
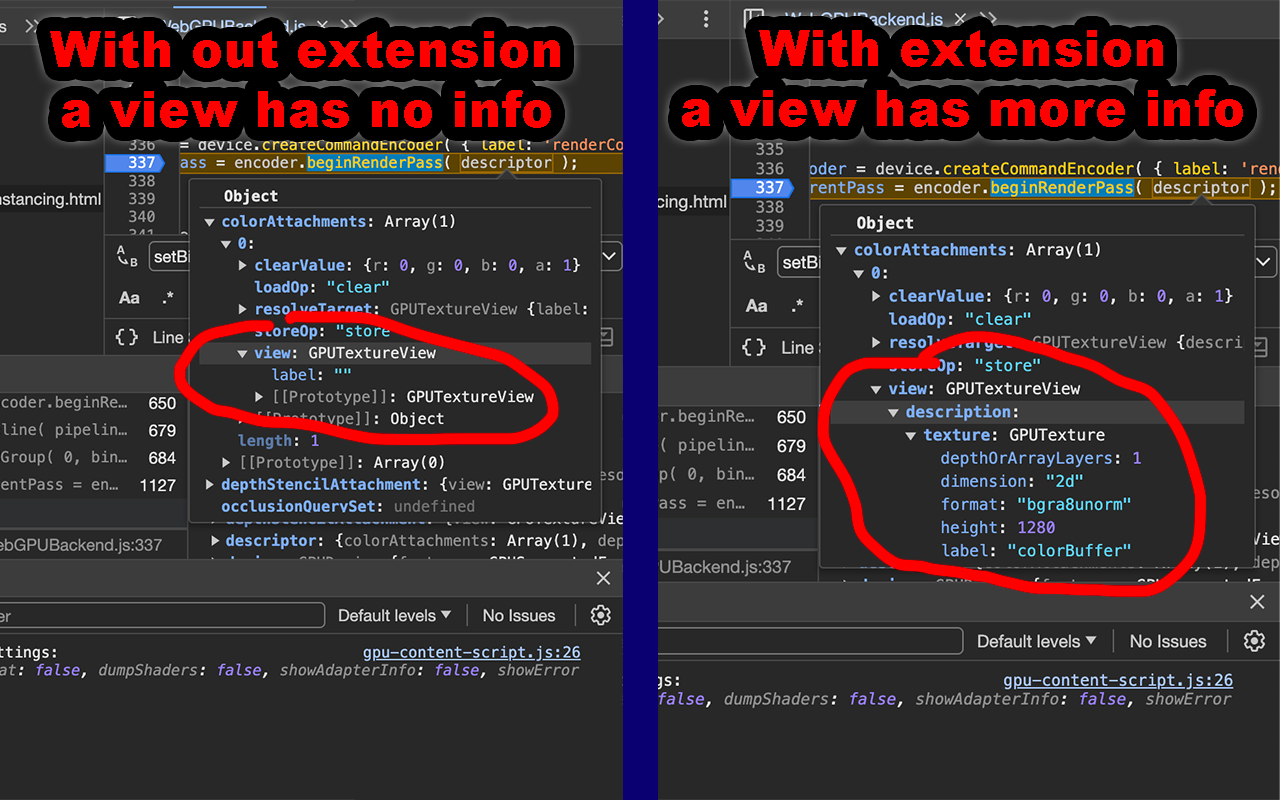
Adds the descriptors used to create many objects to those objects. For example:
When you call createView on a texture you pass in a descriptor. That descriptor is
not reflected in the view itself which can make it hard to see what's going on.
This adds that data onto the view so you can inspect it in the debugger or in the
error messages printed by "Show Errors". Similarly, bindGroups, bindGroupLayouts,
pipelines, pipelineLayouts, pass encoders, query sets, samplers, shader modules,
external textures, ...
Lets you choose one of 'none', 'low-power', 'high-performance', 'compatibility-mode' and 'force-fallback-adapter'
Dumps the pages shaders
Adds labels to objects that don't have them. So for example buffers will
get labels 'buffer1', 'buffer2', etc... which should help you tell
them apart in the debugger. Canvas textures, textures from getCurrentTexture,
are labelled "canvasTexture<num>[<id-of-html-element>]".
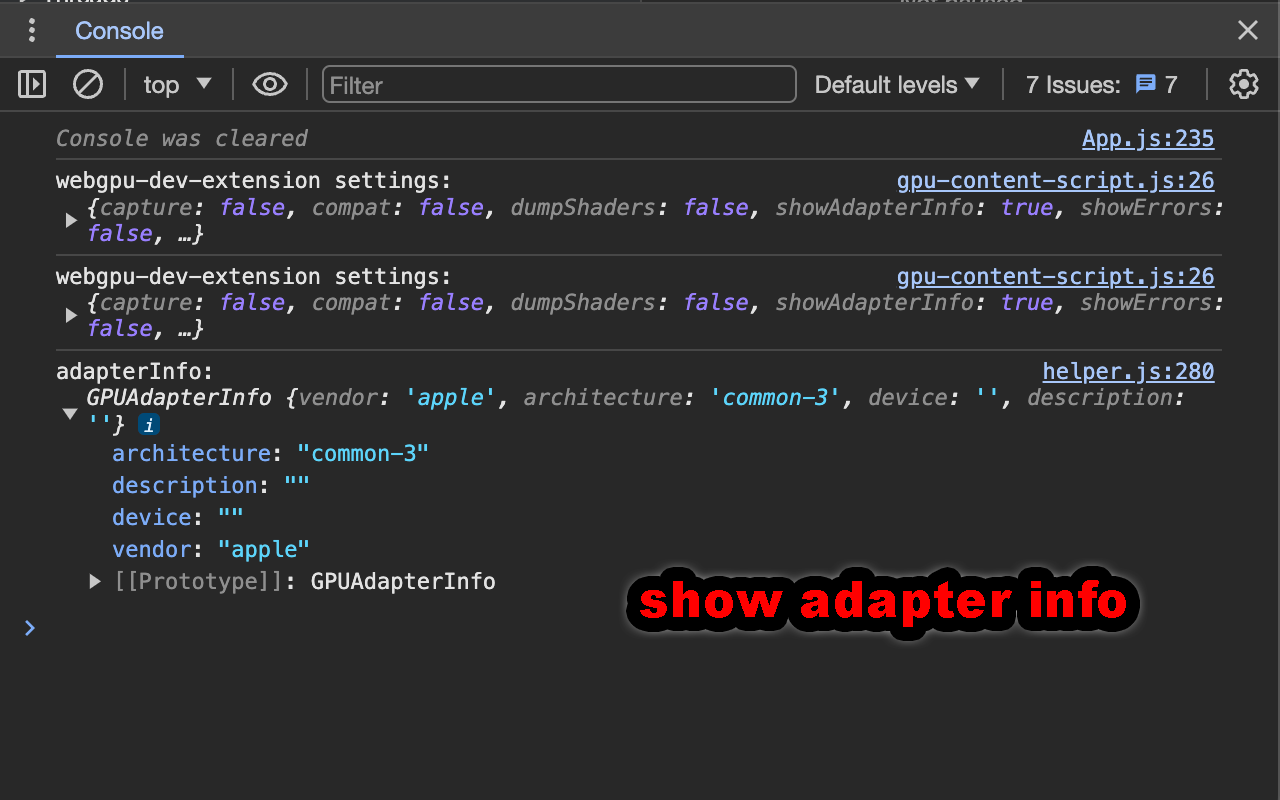
Shows the adapter info anytime requestAdapter is called. This is useful to see which GPU was
selected on a dual GPU computer.
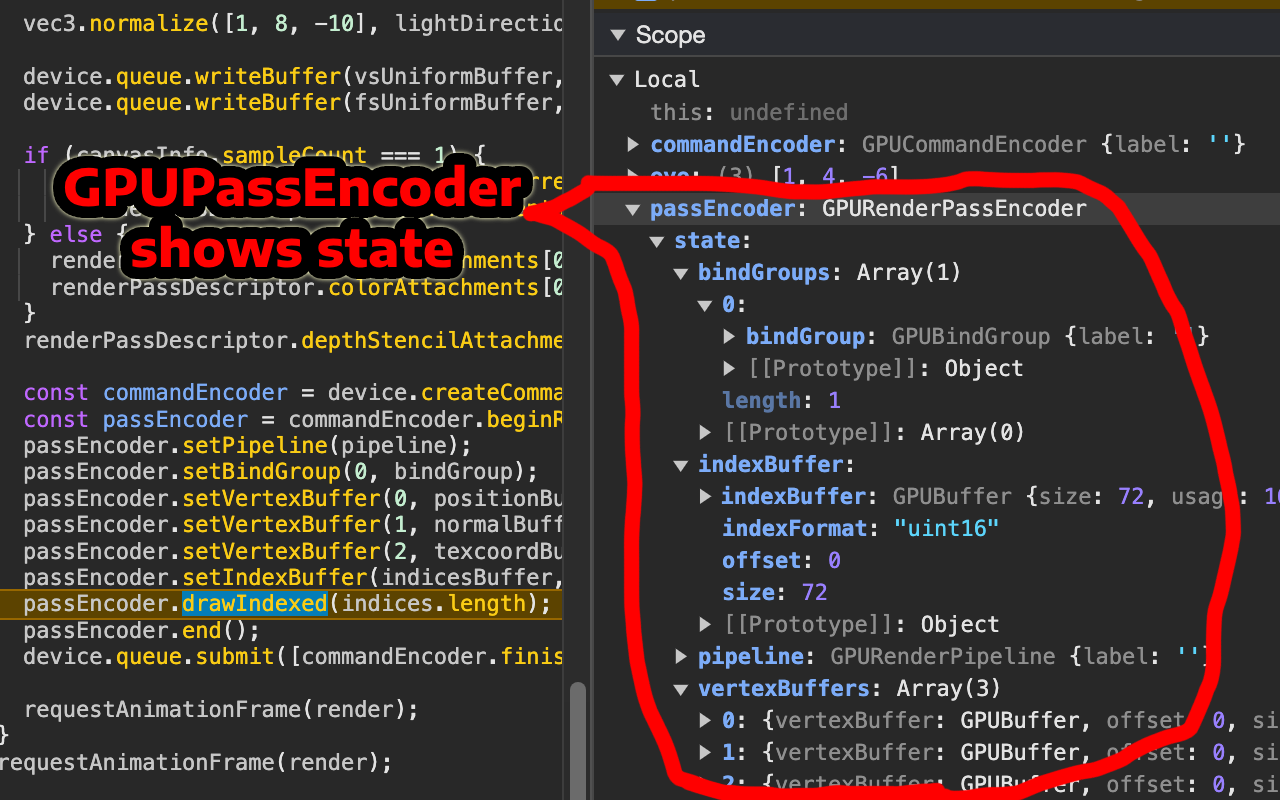
Add a state property to a GPURenderPassEncoder, GPUComputePassEncoder and
GPURenderBundleEncoder that tracks the current pipeline, bindGroups, vertexBuffers,
indexBuffer, viewport, etc.... so you can inspect them in the debugger.
Shows GPUBuffer.usage and GPUTexture.usage with named bits as well as GPUAdapter.features and GPUDevice.features
- without this checked:
GPUTexture { ... usage: 6, ... } - with this checked:
GPUTexture { ... usage: 6 (COPY_DST|TEXTURE_BINDING), ... }
- without this checked:
GPUDevice.features - with this checked:
GPUDevice.features: ['shader-f16', 'timestamp-query', ...]
note: You must turn on custom formatters in the DevTools (Settings->Preferences->Console->Custom formatters).
Prints to the console the number of active WebGPU devices
Lets you block webgpu features. For example, type in shader-f16 and the shader-f16 feature will be blocked.
You can use this to test that your code, that is supposed to run without the feature, actually runs without the
feature.
Enter one or more features separated by space, comma, or new line. * is a wildcard so * = all, texture* =
all features that start with texture. *f16 = all features that end in f16.
Adds a debugger statement to the specified WebGPU API functions.
Enter one or more API method names separated by space, comma, or new line. * is a wildcard
so * = all. Each match is for whole string so
eg. *destroy adds breakpoints to GPUDevice.destroy, GPUBuffer.destroy,
GPUQuerySet.destroy and GPUTexture.destroy where as *fer.des* would only
add a breakpoint to GPUBuffer.destroy. Names are API.methodName so entering
copyTextureToBuffer matches nothing. Use *copyTextureToBuffer or the full name like
GPUCommandEncoder.copyTextureToBuffer.
In DevTools, for each breakpoint added there is a disable variable you can set to disable
the breakpoint for that particular API method.
Returns null from requestAdapter.
Removes navigator.gpu and other GPU classes
Skips requestAnimationFrames. For example, if you're on a 120fps device like an M1 Mac
and you enter 3 then 3 out of 4 frames will be skipped, effectively making your app run
at 30fps. Default = 0
Remember this is not instant. You must refresh the page for it to take affect.
Multiplies the time passed to the requestAnimationFrame callback, as well as performance.now(),
Date.now() and setTimeout(callback,time) and setInterval(callback, time) by this number.
For some apps, if you set this to 0.1 your app will run at 10% speed. If you set it 10 your app will run at 10x speed. Default = 1
Remember this is not instant. You must refresh the page for it to take affect.
Experiment to show what places would fail in compatibility mode
Attempt to capture WebGPU calls to an HTML file using webgpu_recorder
Does not currently work in workers. See Issue.
I don't know all the procedures for other browsers but in Chrome, load the extension by cloning this repo and then
- go to
about://extensions - enable developer mode
- pick "Load Unpacked"
- Select the "extension" folder from this repo
From there, most of JavaScript files that augment the WebGPU API are live. If you edit them, just re-loading the page using the extension
will pick the changes. For UI files, and for service-worker.js, the script that injects the other scripts into your page, it
will only update when you pick the refresh button in about://extensions. The refresh button looks like a circular arrow ↺ inside
each individual extension's info.