-
Statistics simply means numerical data, and is field of math that generally deals with collection of data, tabulation, and interpretation of numerical data.
-
It is actually a form of mathematical analysis that uses different quantitative models to produce a set of experimental data or studies of real life.
-
It is an area of applied mathematics concern with data collection analysis, interpretation, and presentation.
-
Statistics deals with how data can be used to solve complex problems.
Below are the points that explains the types of statistics:
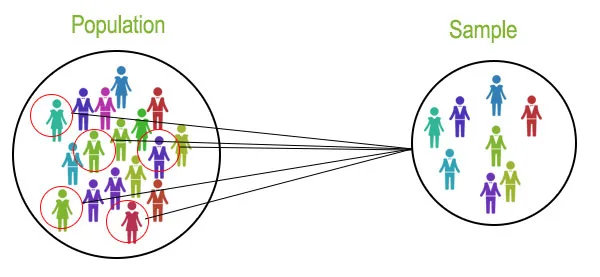
It refers to the collection that includes all the data from a defined group being studied. The size of the population may be either finite or infinite.
-
The study of the entire population is always not feasible, instead, a portion of data is selected from a given population to apply the statistical methods.
-
This portion is called a Sample.
-
The size of the sample is always finite.
- More often termed as “average”, the meaning is the number obtained by computing the sum of all observed values divided by the total number of values present in the data.
EXAMPLE:
import statistics as st
import seaborn as sn
n=[2,23,4,55,5,54,5,54,6,15]
print("Mean of the number is :",st.mean(n))

Mean of the number is : 22.3
-
Median is the middle value when the given data are ordered from smallest to largest. In case of even observations, the median is an average value of 2 middle numbers
import statistics as st
import seaborn as sn
n=[32,23,24,55,54,5,54,6,15]
print("Median of the number is :",st.median(n))

Median of the number is : 24
-
The mode is the most frequent number present in the given data. There can be more than one mode or none depending on the occurrence of numbers.
import statistics as st
import seaborn as sn
n=[84,15,15,15,54,43,15,45,34]
print("Mode of the number is :",st.mode(n))

Mode of the number is : 15
-
Variance is the averaged squared difference from the Mean. The difference is squared to not cancel out the positive and negative values.
import statistics
import seaborn as sn
sample = [2.74, 1.23, 2.63, 2.22, 3, 1.98]
print("Variance of sample set is % s"%(statistics.variance(sample)))

Variance of sample set is 0.40924
-
Standard Deviation measures how spread out the numerical values are.
-
It is the square root of variance.
-
A higher number of Standard Deviation indicates that data is more spread.
import statistics
sample = [1,2,3,4,5,5,5,5,10]
standard_deviation = statistics.stdev(sample)
print(standard_deviation)

2.5549516194593154
-
Difference between the highest and lowest observations within the given data points.
-
With extreme high and low values, the range can be misleading, in such cases interquartile range or std is used.
Quartiles are the numbers that divide the given data points into quarters and are defined as below
Q1: middle value in the first half of the ordered data points
Q2: median of the data points
Q3: middle value in the second half of the ordered data points
IQR: given by Q3-Q1
IQR gives us an idea where most of the data points lie contrary to the range that only provides the difference between the extreme points.
Due to this IQR can also be used to detect outliers in the given data set.
-
Skewness gives us a measure of distortion from symmetry (skew).
-
Depending on whether the left or right tail is skewed for given data distribution, skewness is classified into Positive and Negative skewness as illustrated below
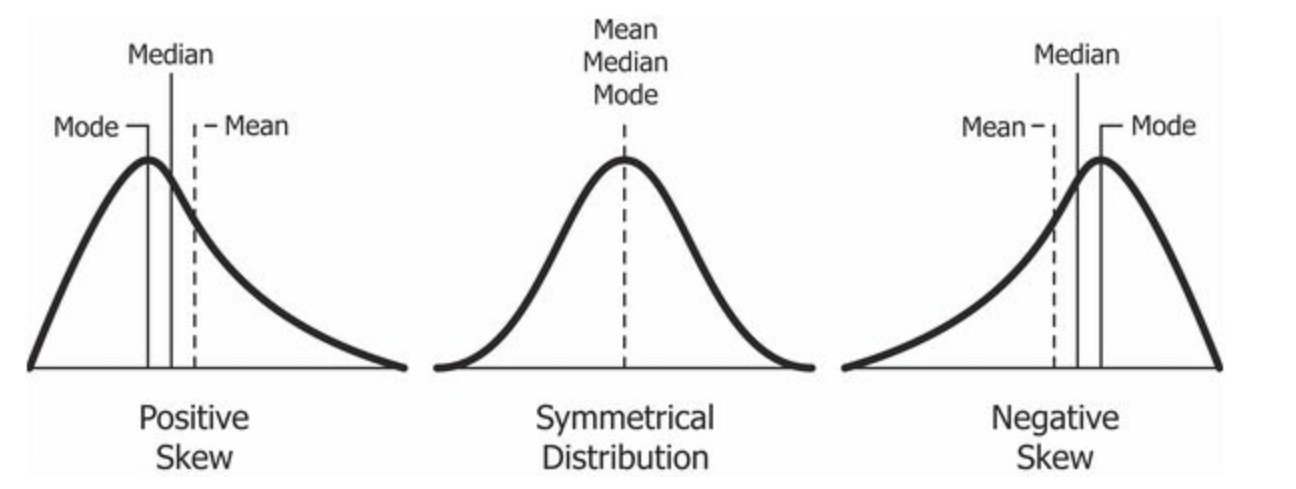
Note: Skewness is 0 for symmetrical or normal distribution.
-
The values that are altering according to circumstances are referred to as variables.
-
A variable can occurs in any form, such as trait, factor or a statement that will constantly be changing according to the changes in the applied environment.
-
Such variables in statistics are broadly divided into four categories such as independent variables, dependent variables, categorical and continuous variables.
-
Apart from these, quantitative and qualitative variables hold data as nominal, ordinal, interval and ratio. Each type of data has unique attributes.
The independent variable is the one that is computed in research to view the impact of dependent variables. It is also called as resultant variables, predictor or experimental variables.
The dependent variable is also called a criterion variable which is applied in non-experimental circumstances. The dependent variable has relied on the independent variable.
It is a wide category of variable which is infinite and has no numerical data. These variables are called as qualitative variables or attribute variable in terms of statistics software.
Such variables are further divided into nominal variables, ordinal and dichotomous variables. Nominal variables don’t have any intrinsic order.
The variables which measure some count or quantity and don’t have any boundaries are are termed as continuous variables. It can be segregated into ratio or interval, or discrete variables.
Interval variables have their centralized attribute, which is calibrated along with a range with some numerical values.
-
Inferential Statistics makes inference and prediction about population based on a sample of data taken from population. It generalizes a large dataset and applies probabilities to draw a conclusion.
-
It is simply used for explaining meaning of descriptive stats. It is simply used to analyze, interpret result, and draw conclusion.
-
Inferential Statistics is mainly related to and associated with hypothesis testing whose main target is to reject null hypothesis.
-
Inferential statistics can be done with help of various steps as given below:
1.Obtain and start with a theory.
2.Generate a research hypothesis.
3.Operationalize or use variables
4.Identify or find out population to which we can apply study material.
5.Generate or form a null hypothesis for these population.
6.Collect and gather a sample of children from population and simply run study.
7.Then, perform all tests of statistical to clarify if obtained characteristics of sample are sufficiently different from what would be expected under null hypothesis so that we can be able to find and reject null hypothesis.
Various types of inferential statistics are used widely nowadays and are very easy to interpret. These are given below:
- One sample test of difference/One sample hypothesis test
- Confidence Interval
- Contingency Tables and Chi-Square Statistic
- T-test or Anova
- Pearson Correlation
- Bi-variate Regression
- Multi-variate Regression
- Hypothesis Testing is a statistical method used to draw inferences about the overall population. It is basically the assumption we make about the population parameter.
a) Null Hypothesis(H0): It is the hypothesis to be tested. It suggests a notion that there is no relationship or association between the 2 parameters being studied e.g. Music influences mental health.
b) Alternate Hypothesis (HA): All the other ideas contrasting the null hypothesis form the Alternate Hypothesis e.g. Music do not influence mental health.
-
Type 1 Error: Denoted by alpha, this error occurs when we reject the null hypothesis even though it’s true.
-
Type 2 Error: Denoted by beta, this error occurs when we accept the null hypothesis when it’s actually false.
- The branch of statistics concerned with quantitatively describing, visually presenting, or summarizing data is called descriptive statistics.
- In descriptive statistics, you analyze data using tabular, graphical, and numerical methods.
- Using the Descriptive Statistics techniques, you can only make conclusions about the data being analyzed or summarized.
- You do not/cannot make any conclusion beyond that data because, in Descriptive Statistics, you do not assume the data being analyzed to be a Sample coming from a larger Population. In other words, Descriptive Statistics is not Inferential Statistics.

-
There are three methods to perform descriptive statistics. They are Numerical, Tabular, and Graphical methods.
-
Depending on whether you analyze one or more variables simultaneously, the analysis is called Univariate, Bivariate, or Multivariate.
Univariate analysis – Analysis of only one variable at a time.
Bivariate and multivariate analysis – The simultaneous analysis of two or more variables is called bivariate or multivariate analysis.
Numerical methods as the name suggest is all about summarizing data by way of numbers. The most common ways of summarizing data using numerical methods are:
a) Measures of Central Tendency – Mean, Median, and Mode.
b)Measures of Dispersion – Standard Deviation, Variance, Range, and Inter-Quartile Range.
-
Tabular Methods summarizes the data in table form.
-
The data is aggregated or summarized at the category level to show the count (frequency) of observations in each category.
-
Tabular Methods are mostly used for categorical variables.
-
The tabular reports can be made more informative by having proportions along with the absolute counts.
- Graphical Methods are a visual representation of the data.
- Visuals are an important tool in the hands of the data scientist to present their analysis of the data. One can use a variety of charts and graphs to represent data.
- Some of the important ones are:
Bar Plot
Histogram
Box Plot
Pie Chart
Line Plot
Scatter Plot
-
Less time consuming: Because it is secondary data it is usually cheap and is less time consuming because someone else has compiled it.
-
Patterns and correlations are clear and visible: Statistical data is data that has already been analyzed and therefore the patterns and correlations have already been done and are clear and visible.
-
Taken from large samples so the generalizability is high: Statistical data is data that has been gathered from very large data samples. This means that the generalization is higher.
-
Can be used and re-used to check different variables: Statistical data is data that can be used and reused. It does not require one time usage as the same data can be used to make a different decision.
-
Can be imitated: Statistical data can be imitated to check changes which increases reliability and representativeness of the data.
-
Unverified: The researcher cannot check validity and can’t find a mechanism for a causation theory only draw patterns and correlations from the data. This means the researcher has limited options to verify the validity and authenticity of the data.
-
Can be misinterpreted: Statistical data is often secondary data which means that it can be easily be misinterpreted. This leaves the researcher vulnerable to distortion of information without the ability to make confirmations.
-
It can be manipulated: Statistical data is open to abuse it can be manipulated and phrased to show the point the researcher wants to show. This makes the data wanting in objectivity and more subjective in nature.
-
Because this is often secondary data it is hard to access and check: Statistical data is mostly secondary data that can only be accessed. It may be quite difficult to check and verify the data because the primary source of the data is unavailable.
-
It is not appropriate: Statistical data is not an appropriate method to understand issues in great depth and identify ways to solve problems highlighted. This is because the data is collected from primary sources by an independent researcher.
-
Research Interpretations and Conclusions
-
Meta-Analysis of Literature Reviews.
-
Clinical Trial Design.
-
Designing Surveys.
-
Epidemiological Studies.
-
Statistical Modeling.
- Here, we learned about the basic concepts of statistics.
- We also learned about the terms used in statistics.
- We learnt that statistics could be divided into two parts and understood both types.