Chart.js is one the most popular javascript charting library. Dash Chartjs Component is a Dash component library that renders ChartJs React component inside Dash App.
pip install dash-chartjs
id (str): The ID used to identify this component in Dash callbacks.
type (str): Chart.js chart type.
data (dict): The data object that is passed into the Chart.js chart.
options (dict): The options object that is passed into the Chart.js chart.
redraw (boolean): Teardown and redraw chart on every update.
toolbox (boolean): Toolbox with reset and download buttons for chart.
customJSFunctions (dict): Write custom JS functions in dict format.
customPlugins (dict): Write Plugins in dict format.
clickData (dict): clickData returns the datasetIndex and index of data point clicked.
style (dict): Defines CSS styles which will override styles previously set.
from dash import dash,html
import pandas as pd
from dash_chartjs import ChartJs

app = dash.Dash(__name__,meta_tags=[{"name": "viewport", "content": "width=device-width, initial-scale=1"}])

df = pd.read_csv('https://raw.githubusercontent.com/JetBlack101/visitors-to-georgia-ts-analysis/main/Data/VisitorsToGeorgia_2011-2019.csv')

df['Date'] = pd.to_datetime(df['Date'])

x = df['Date']
y = df['Visitors']

data = {
    'labels': x,
    'datasets': [{
        'label': 'Visitors to Georgia',
        'data': y,
        'fill':'false',
        'borderColor': 'rgb(75, 192, 192)',
        'tension': 0.1
    }]
}
options = {
    'scales': {
        'x': {
            'type':'time'
        }
    },
    'plugins':{
        'zoom':{
            'zoom':{
                'wheel':{
                    'enabled': True
                },
            'mode':'xy'
            }
        }
    }
}


app.layout = html.Div(
    [
        ChartJs(type='line',data=data,options=options)
    ]
)

if __name__ == '__main__':
app.run_server(debug=False)Dash_ChartJS.mp4
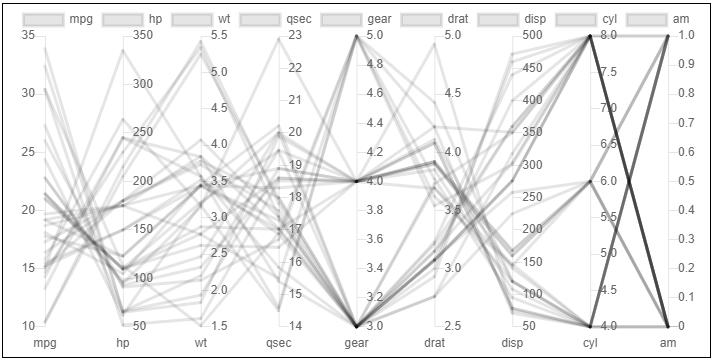
Example

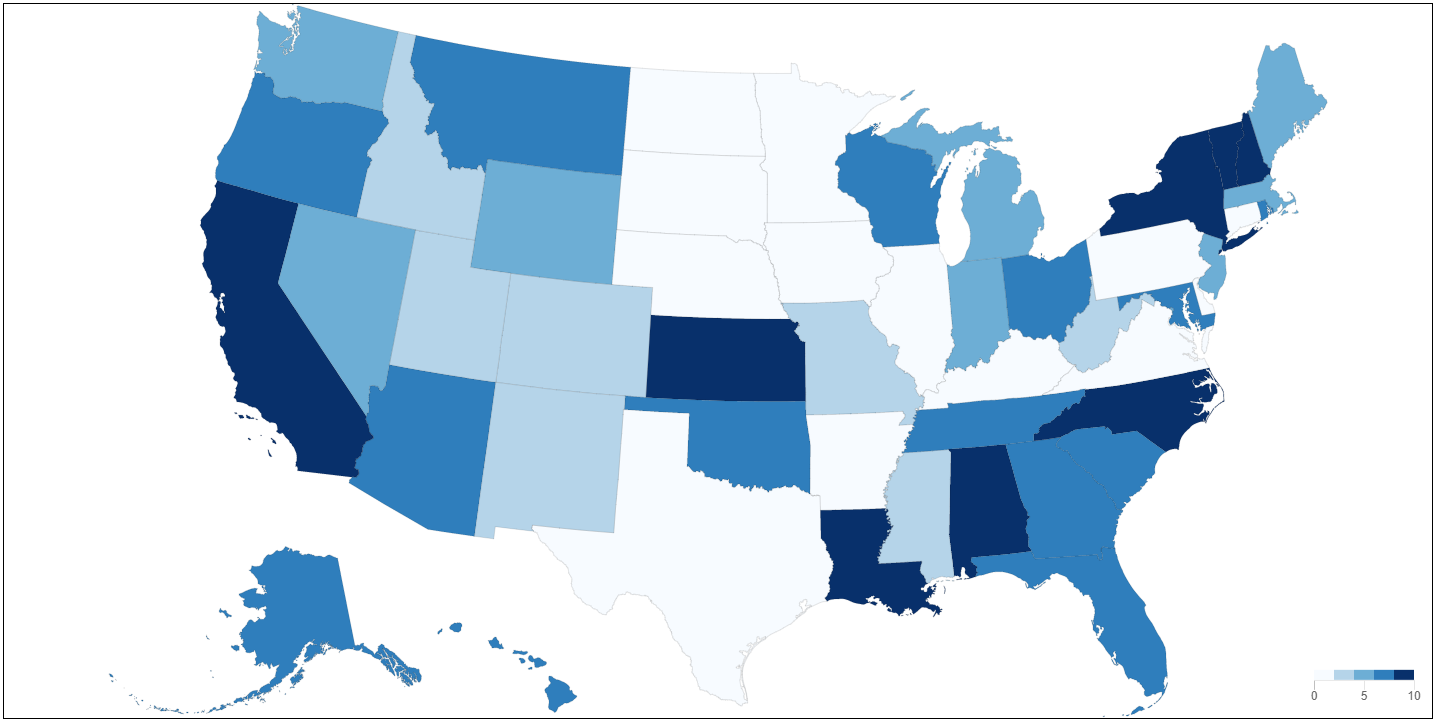
Example

Example
Example

Example

Example

Example

Example

Example