k6 is an open-source load testing tool that helps you catch performance issues and regressions earlier.
With the k6 integration, you can track performance metrics of k6 tests to:
- Correlate application performance with load testing metrics.
- Create alerts based on performance testing metrics.
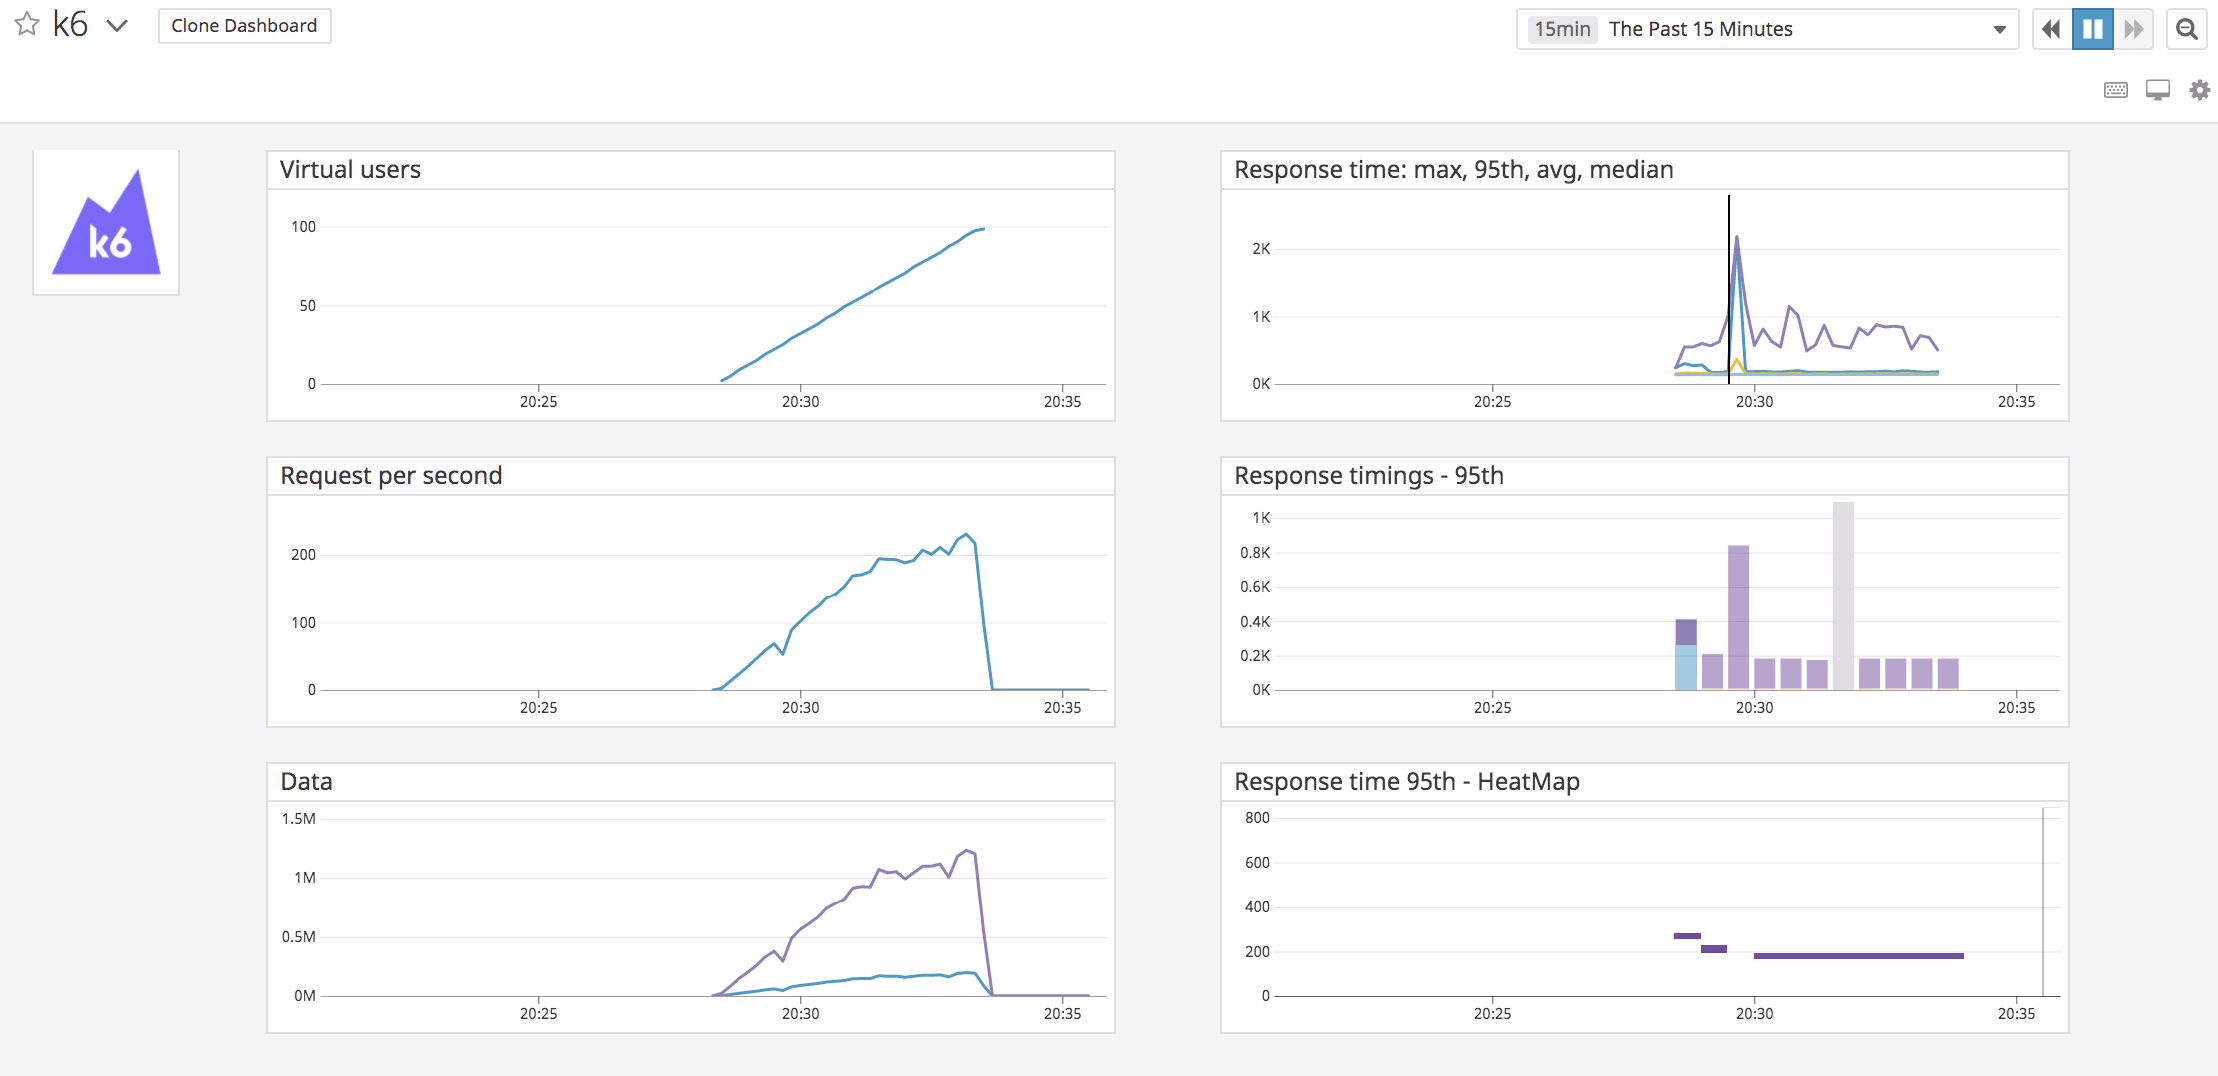
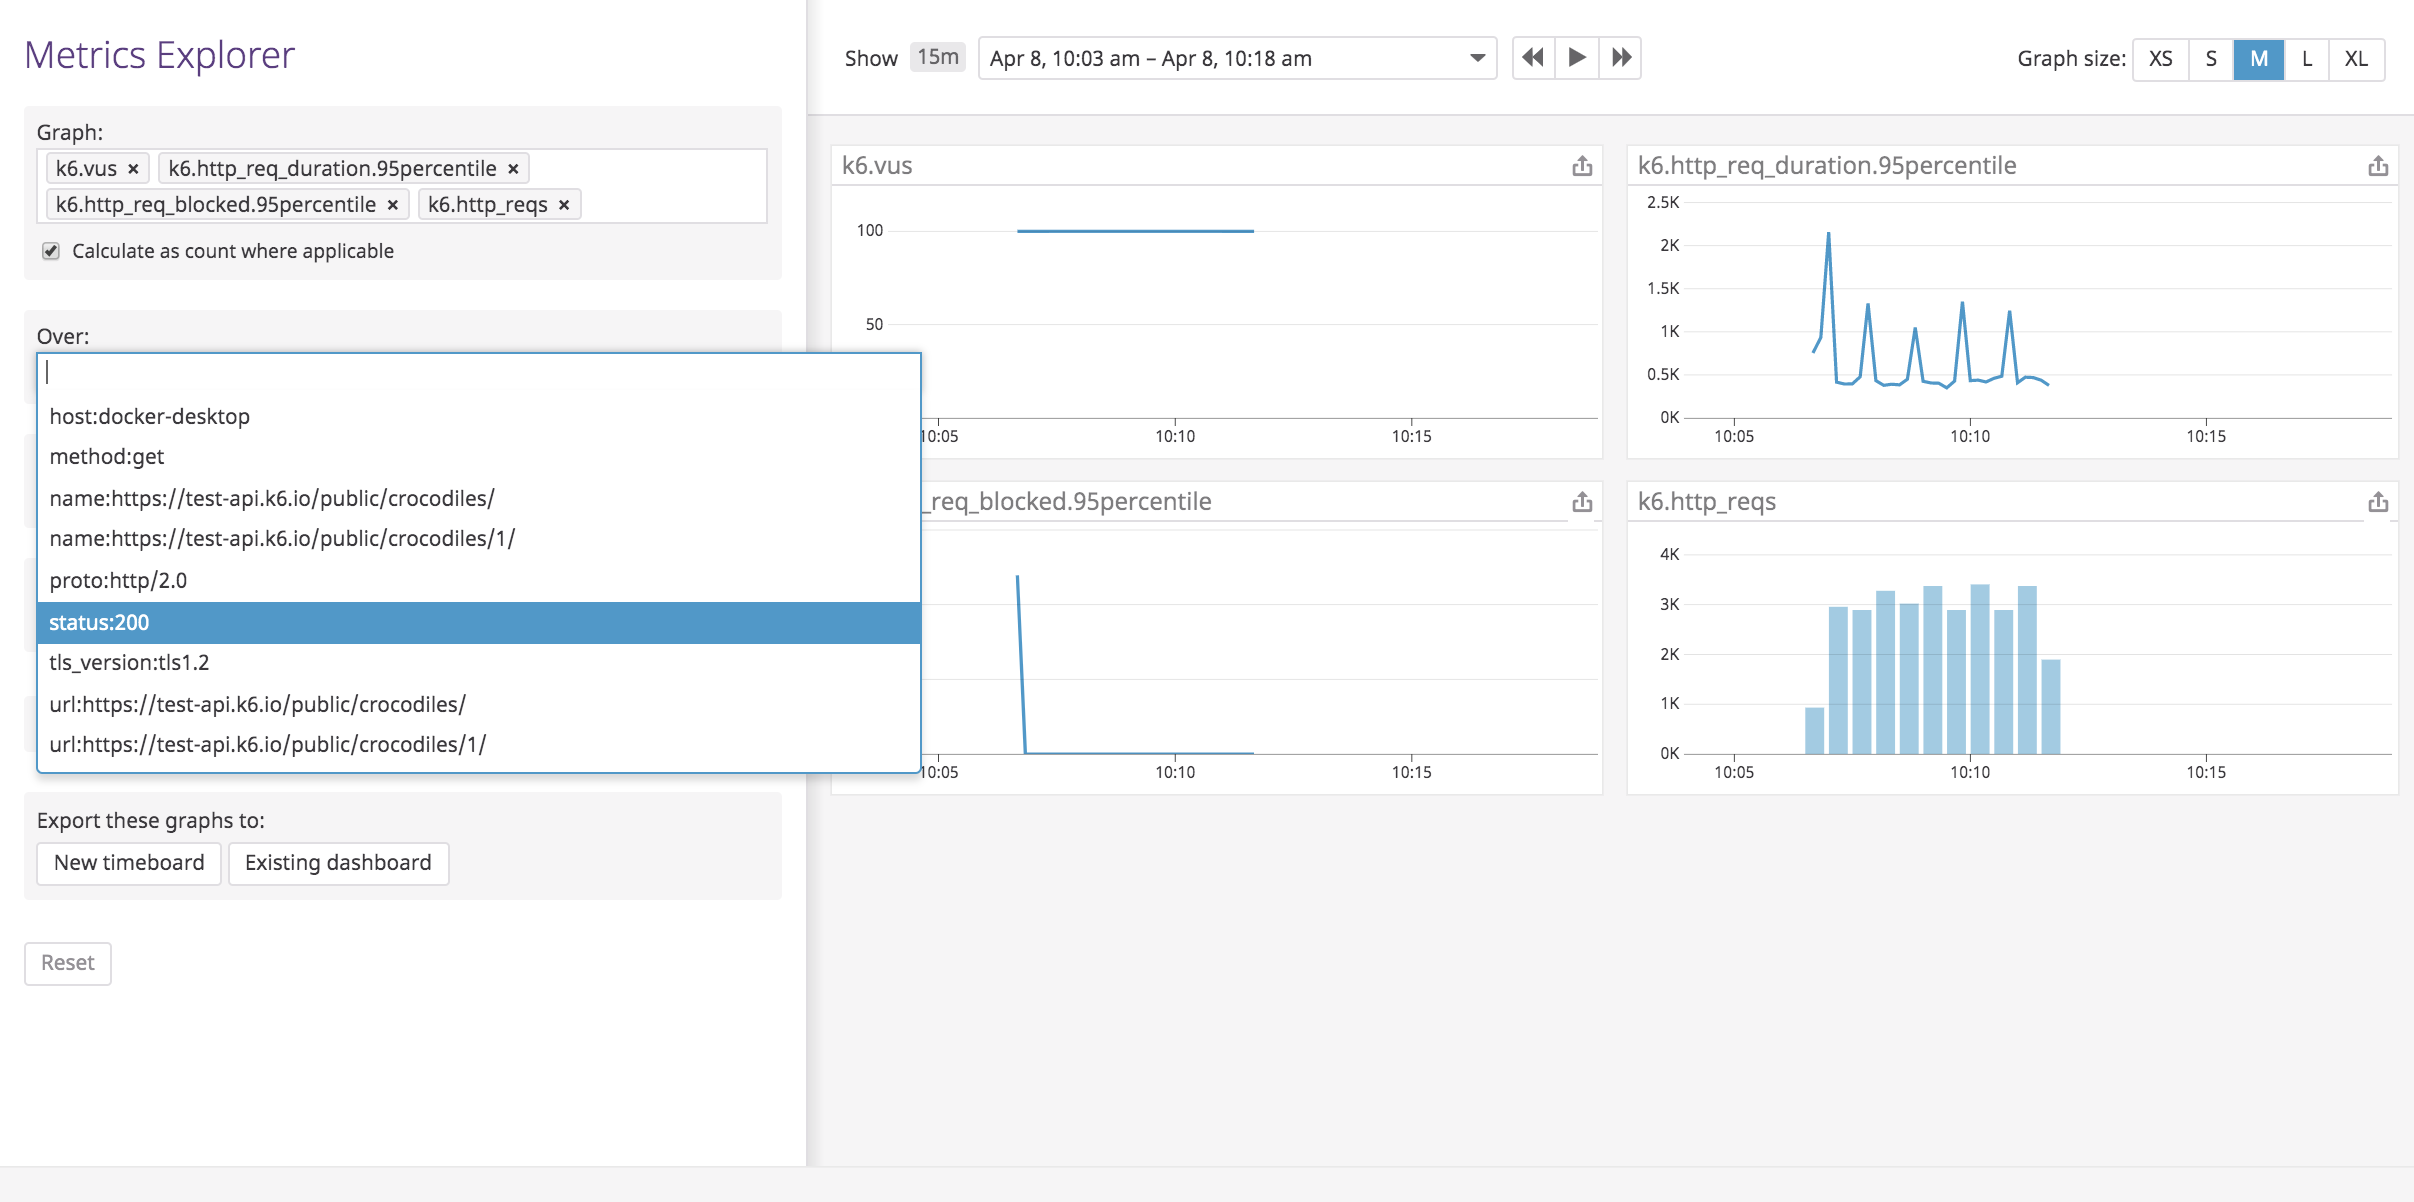
- Analyze and visualize k6 metrics using the k6 Datadog Dashboard or Metrics Explorer.
For the detailed instructions, follow the k6 documentation.
-
In Datadog, navigate to Integrations > API to copy your API key.
-
Run the Datadog Agent:
To get k6 metrics into Datadog, k6 sends metrics through the Datadog Agent, which collects, aggregates, and forwards the metrics to the Datadog platform.
Run the Datadog Agent service as a Docker container with this command:
DOCKER_CONTENT_TRUST=1 \ docker run -d \ --name datadog \ -v /var/run/docker.sock:/var/run/docker.sock:ro \ -v /proc/:/host/proc/:ro \ -v /sys/fs/cgroup/:/host/sys/fs/cgroup:ro \ -e DD_SITE="datadoghq.com" \ -e DD_API_KEY=<YOUR_DATADOG_API_KEY> \ -e DD_DOGSTATSD_NON_LOCAL_TRAFFIC=1 \ -p 8125:8125/udp \ datadog/agent:latestNote: Replace
<YOUR_DATADOG_API_KEY>with your API key. If your account is registered with Datadog EU, change the value ofDD_SITEtodatadoghq.eu. -
Run the k6 test and output the results to Datadog.
Once the Datadog Agent service is running, run the k6 test and send the metrics to the Agent with:
K6_STATSD_ENABLE_TAGS=true k6 run --out xk6-output-statsd script.js
-
Visualize the k6 metrics in Datadog.
While running the test, k6 sends metrics periodically to DataDog. By default, these metrics have
k6.as the name prefix.You can visualize k6 metrics in realtime with the metrics explorer, monitors, or custom dashboards.
Additionally, the first time Datadog detects the
k6.http_reqsmetric, the k6 integration tile is installed automatically, and the default k6 dashboard is added to your dashboard list.
See metadata.csv for a list of metrics provided by this integration.
The k6 integration does not include any service checks.
The k6 integration does not include any events.
Need help? Read the k6 Datadog documentation or contact k6 support.