Postman is an API platform that simplifies the steps of building an API and streamlines collaboration so you can create better APIs-faster.
This integration helps you stay on top of your monitors' health. It enables you to:
-
Analyze the metrics of Postman Monitoring runs in Datadog
-
Generate events for successful and failed monitoring runs.
You can find detailed instructions in Postman's documentation. Postman Integrations require a Postman Team, Business, or Enterprise plan.
- Generate a Datadog API key.
- Sign in to your Postman account and navigate to the Datadog integration.
- Select "Add Integration."
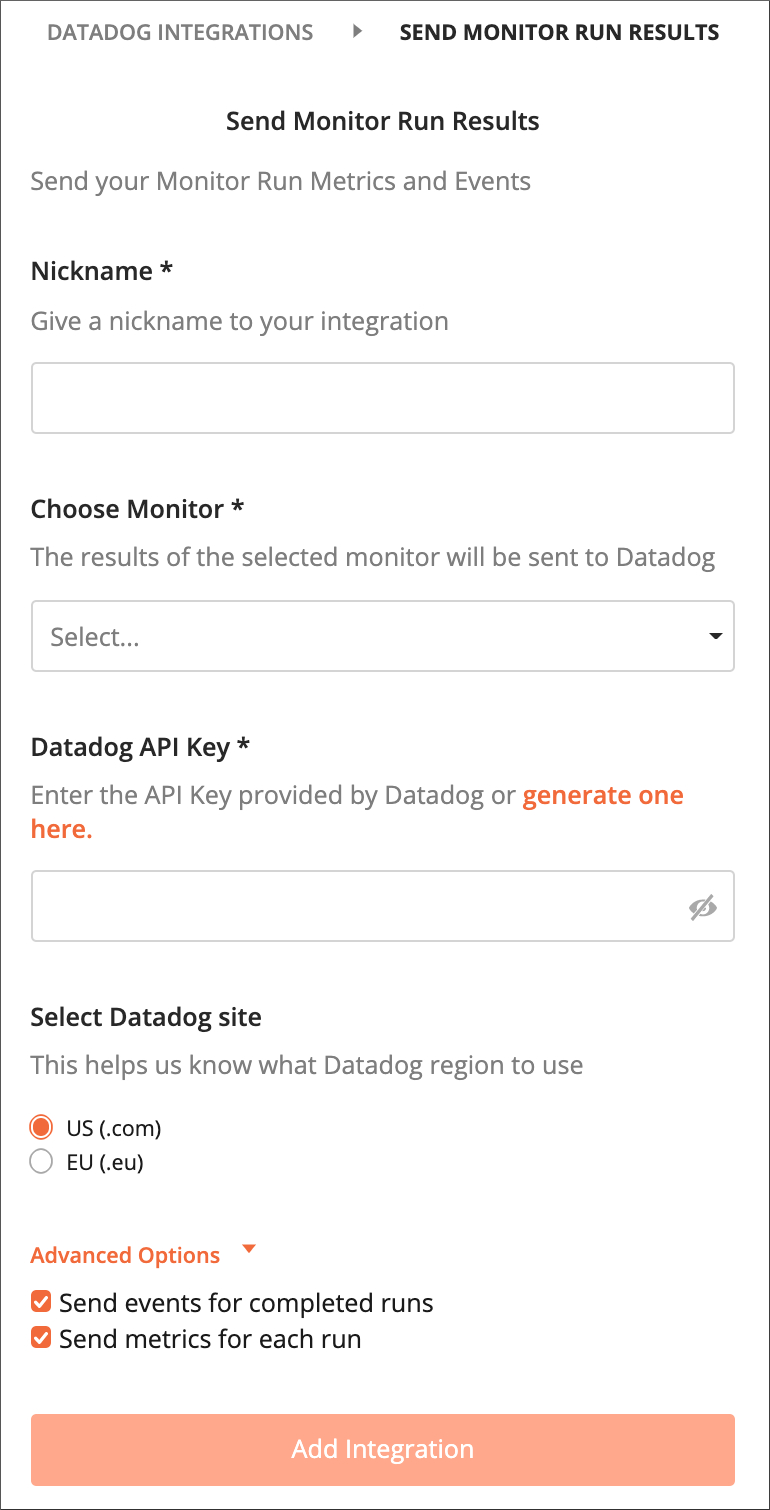
- To send your monitor metrics and events to Datadog:
- Name your new integration.
- Select the monitor whose data you would like to send to Datadog.
- Enter your Datadog API key.
- Select the Datadog region you would like to use.
- Optionally choose if you want to send events, metrics or both for each run.
- Then select "Add Integration" to finish setting up the integration.
See metadata.csv for a list of metrics provided by this integration.
Postman does not include any service checks.
An event is generated each time a monitor runs in Postman. The severity of the event is based on the tests in the Postman monitor:
| Severity | Description |
|---|---|
Low |
If all the tests pass |
Normal |
If some tests fail, or an error occurs in the execution of any event. |
Need help? Contact Postman Support.