The Apollo Datadog integration enables you to forward Studio performance metrics to your Datadog account. Datadog supports an advanced function API, which enables you to create graphs and alerts for GraphQL metrics.
Studio forwards the following metrics to Datadog:
-
apollo.operations.count- The number of GraphQL operations that were executed. This includes queries, mutations, and operations that resulted in an error. -
apollo.operations.error_count- The number of GraphQL operations that resulted in an error. This includes GraphQL execution errors, and HTTP errors if Studio failed to connect to your server. -
apollo.operations.cache_hit_count- The number of GraphQL queries for which the result was served from Apollo Server's full query cache. -
A histogram of GraphQL operation response times, measured in milliseconds. Due to Studio's aggregation method (logarithmic binning), these values are accurate to +/- 5%:
apollo.operations.latency.minapollo.operations.latency.medianapollo.operations.latency.95percentileapollo.operations.latency.99percentileapollo.operations.latency.maxapollo.operations.latency.avg
These metrics are aggregated in 60-second intervals and tagged with the GraphQL operation name as operation:<query-name>. Unique query signatures with the same operation name are merged, and queries without an operation name are ignored.
These metrics are also tagged with both the associated Studio graph ID (as graph:<graph-id>) and the associated variant name (as variant:<variant-name>), so multiple graphs from Studio can send data to the same Datadog account. If you haven't set a variant name, then current is used.
(Integrations set up prior to October 2020 have metric names starting with apollo.engine.operations instead of apollo.operations and use a service tag instead of graph. You can migrate to the new metric names in your graph's Integrations page in Apollo Studio.)
Getting set up with the Apollo Datadog integration is as simple as providing a Datadog API key and region to Studio. There's no further configuration required.
-
Go to your Datadog Integrations page and click on the Apollo tile. Then go to the Configuration tab and click Install Integration at the bottom.
-
Go to your Datadog APIs page and create an API key.
-
Determine your Datadog API region by looking at your browser's address bar:
- If the domain name is
app.datadoghq.com, then your API region isUS. - If the domain name is
app.datadoghq.eu, then your API region isEU.
-
In Studio, go to your graph's Integrations page:
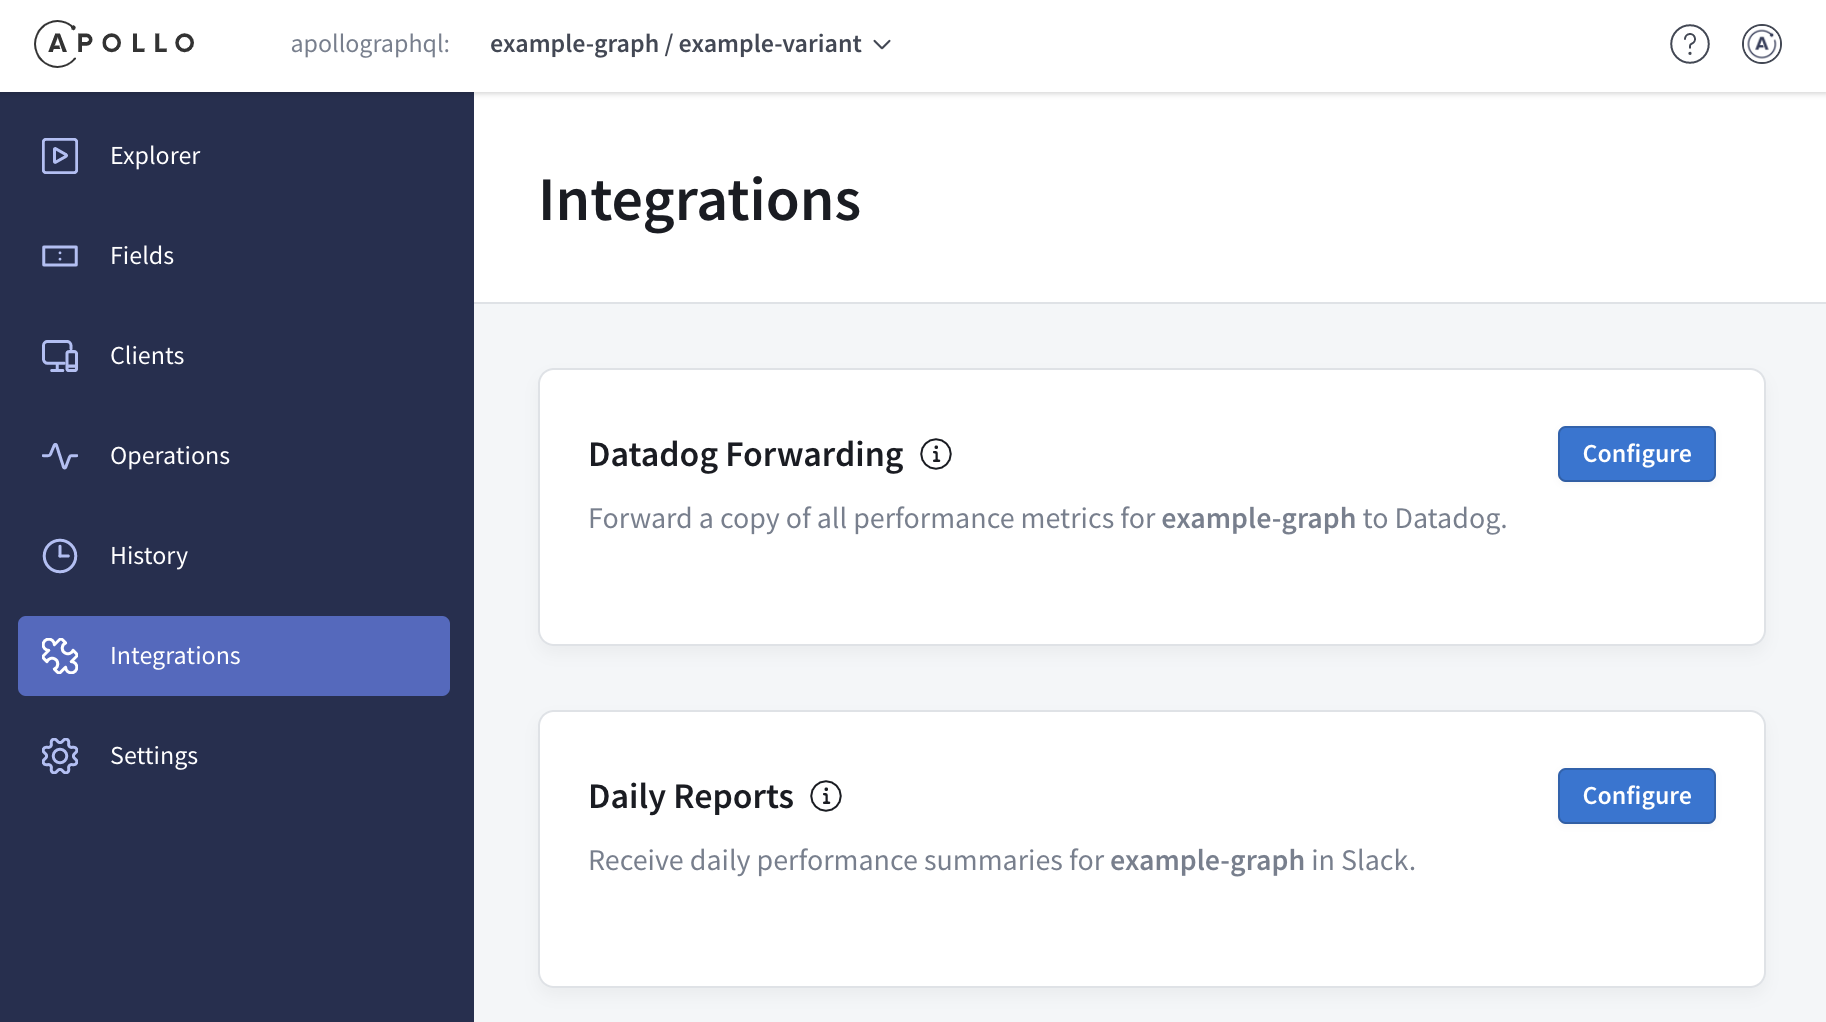
-
In the Datadog Forwarding section, click Configure. Provide your API key and region, then click Enable. Because all forwarded metrics are tagged with the corresponding graph's ID (
graph:<graph-id>), you can use the same API key for all of your graphs.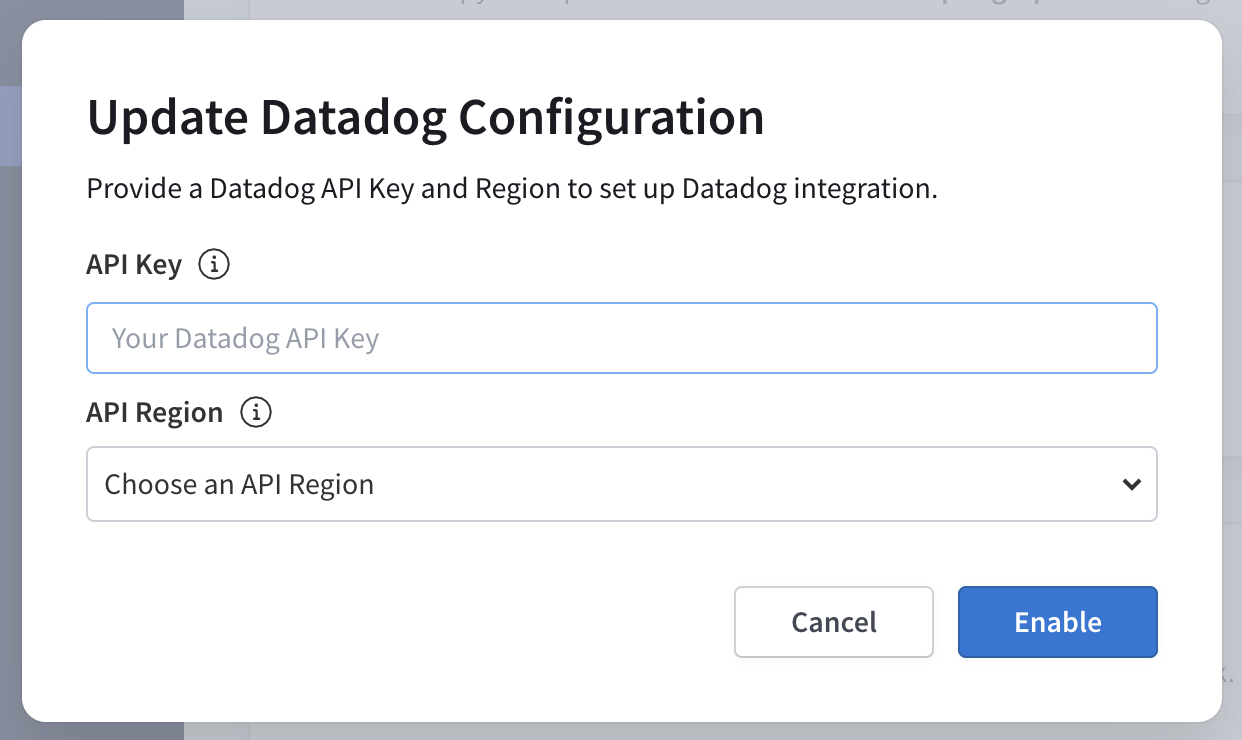
-
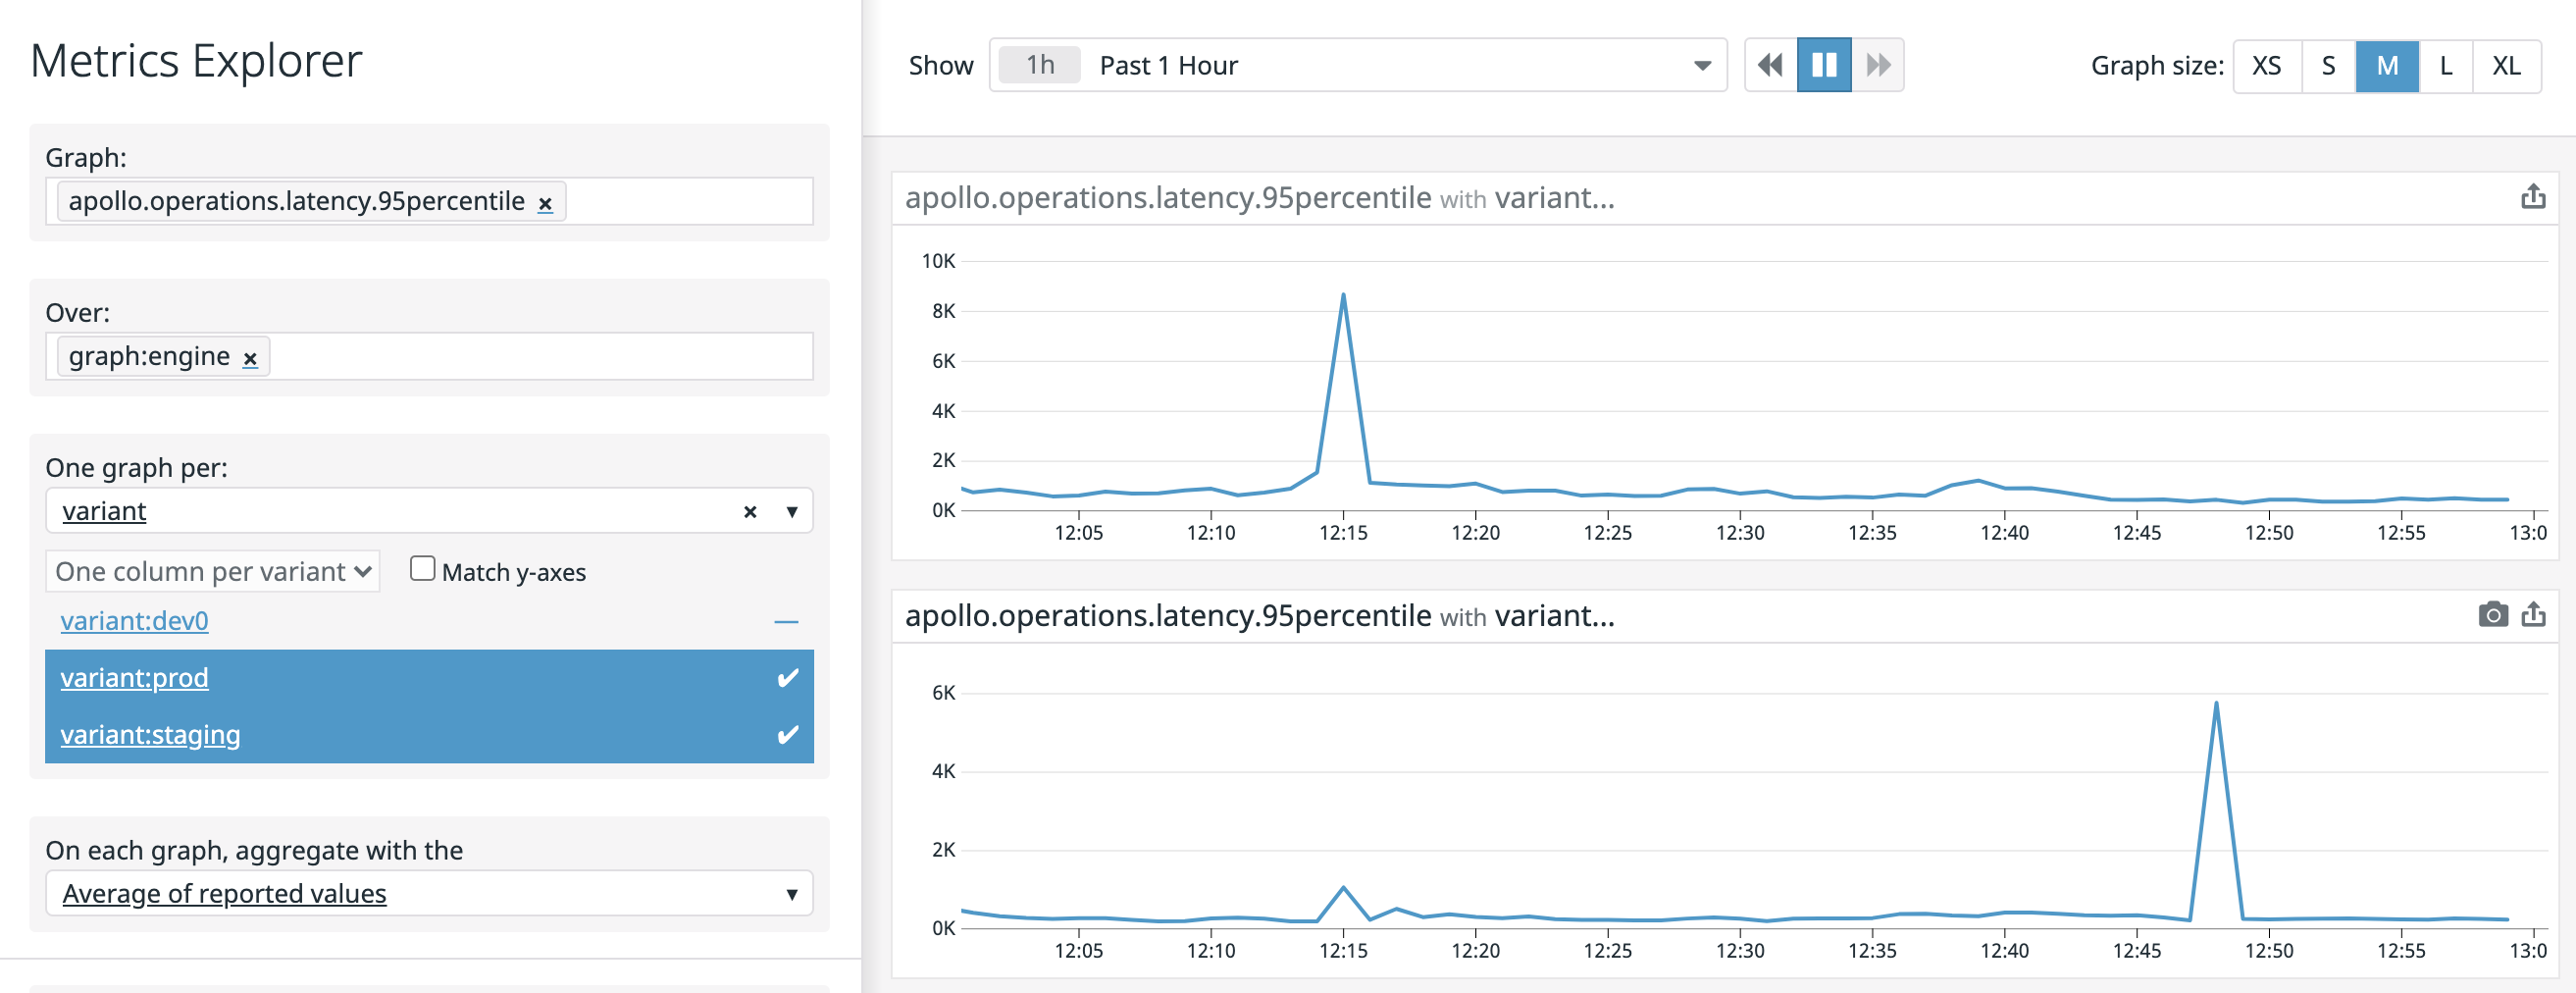
Go to the Datadog metrics explorer to see your metrics. Metrics may take up to five minutes to be visible.
See the Apollo integrations docs for more detailed usage information.
See metadata.csv for a list of metrics provided by this integration.
The Apollo integration does not include any events at this time.
The Apollo integration does not include any service checks at this time.
Need help? Contact Datadog Support.