Skip to content
@Kanaries

Kanaries

Make visual exploration accessible for everyone

Welcome to Kanaries Open Source Community 👋

Kanaries is an open source startup that focus on data exploration and data visualization. We build softwares that automates the workflow of data exploration to help users to understand data better and faster.

Open Source Family

Solution Description Image
Graphic Walker Embeddable analytic solution, embed an interactive visual analytic component in your system.
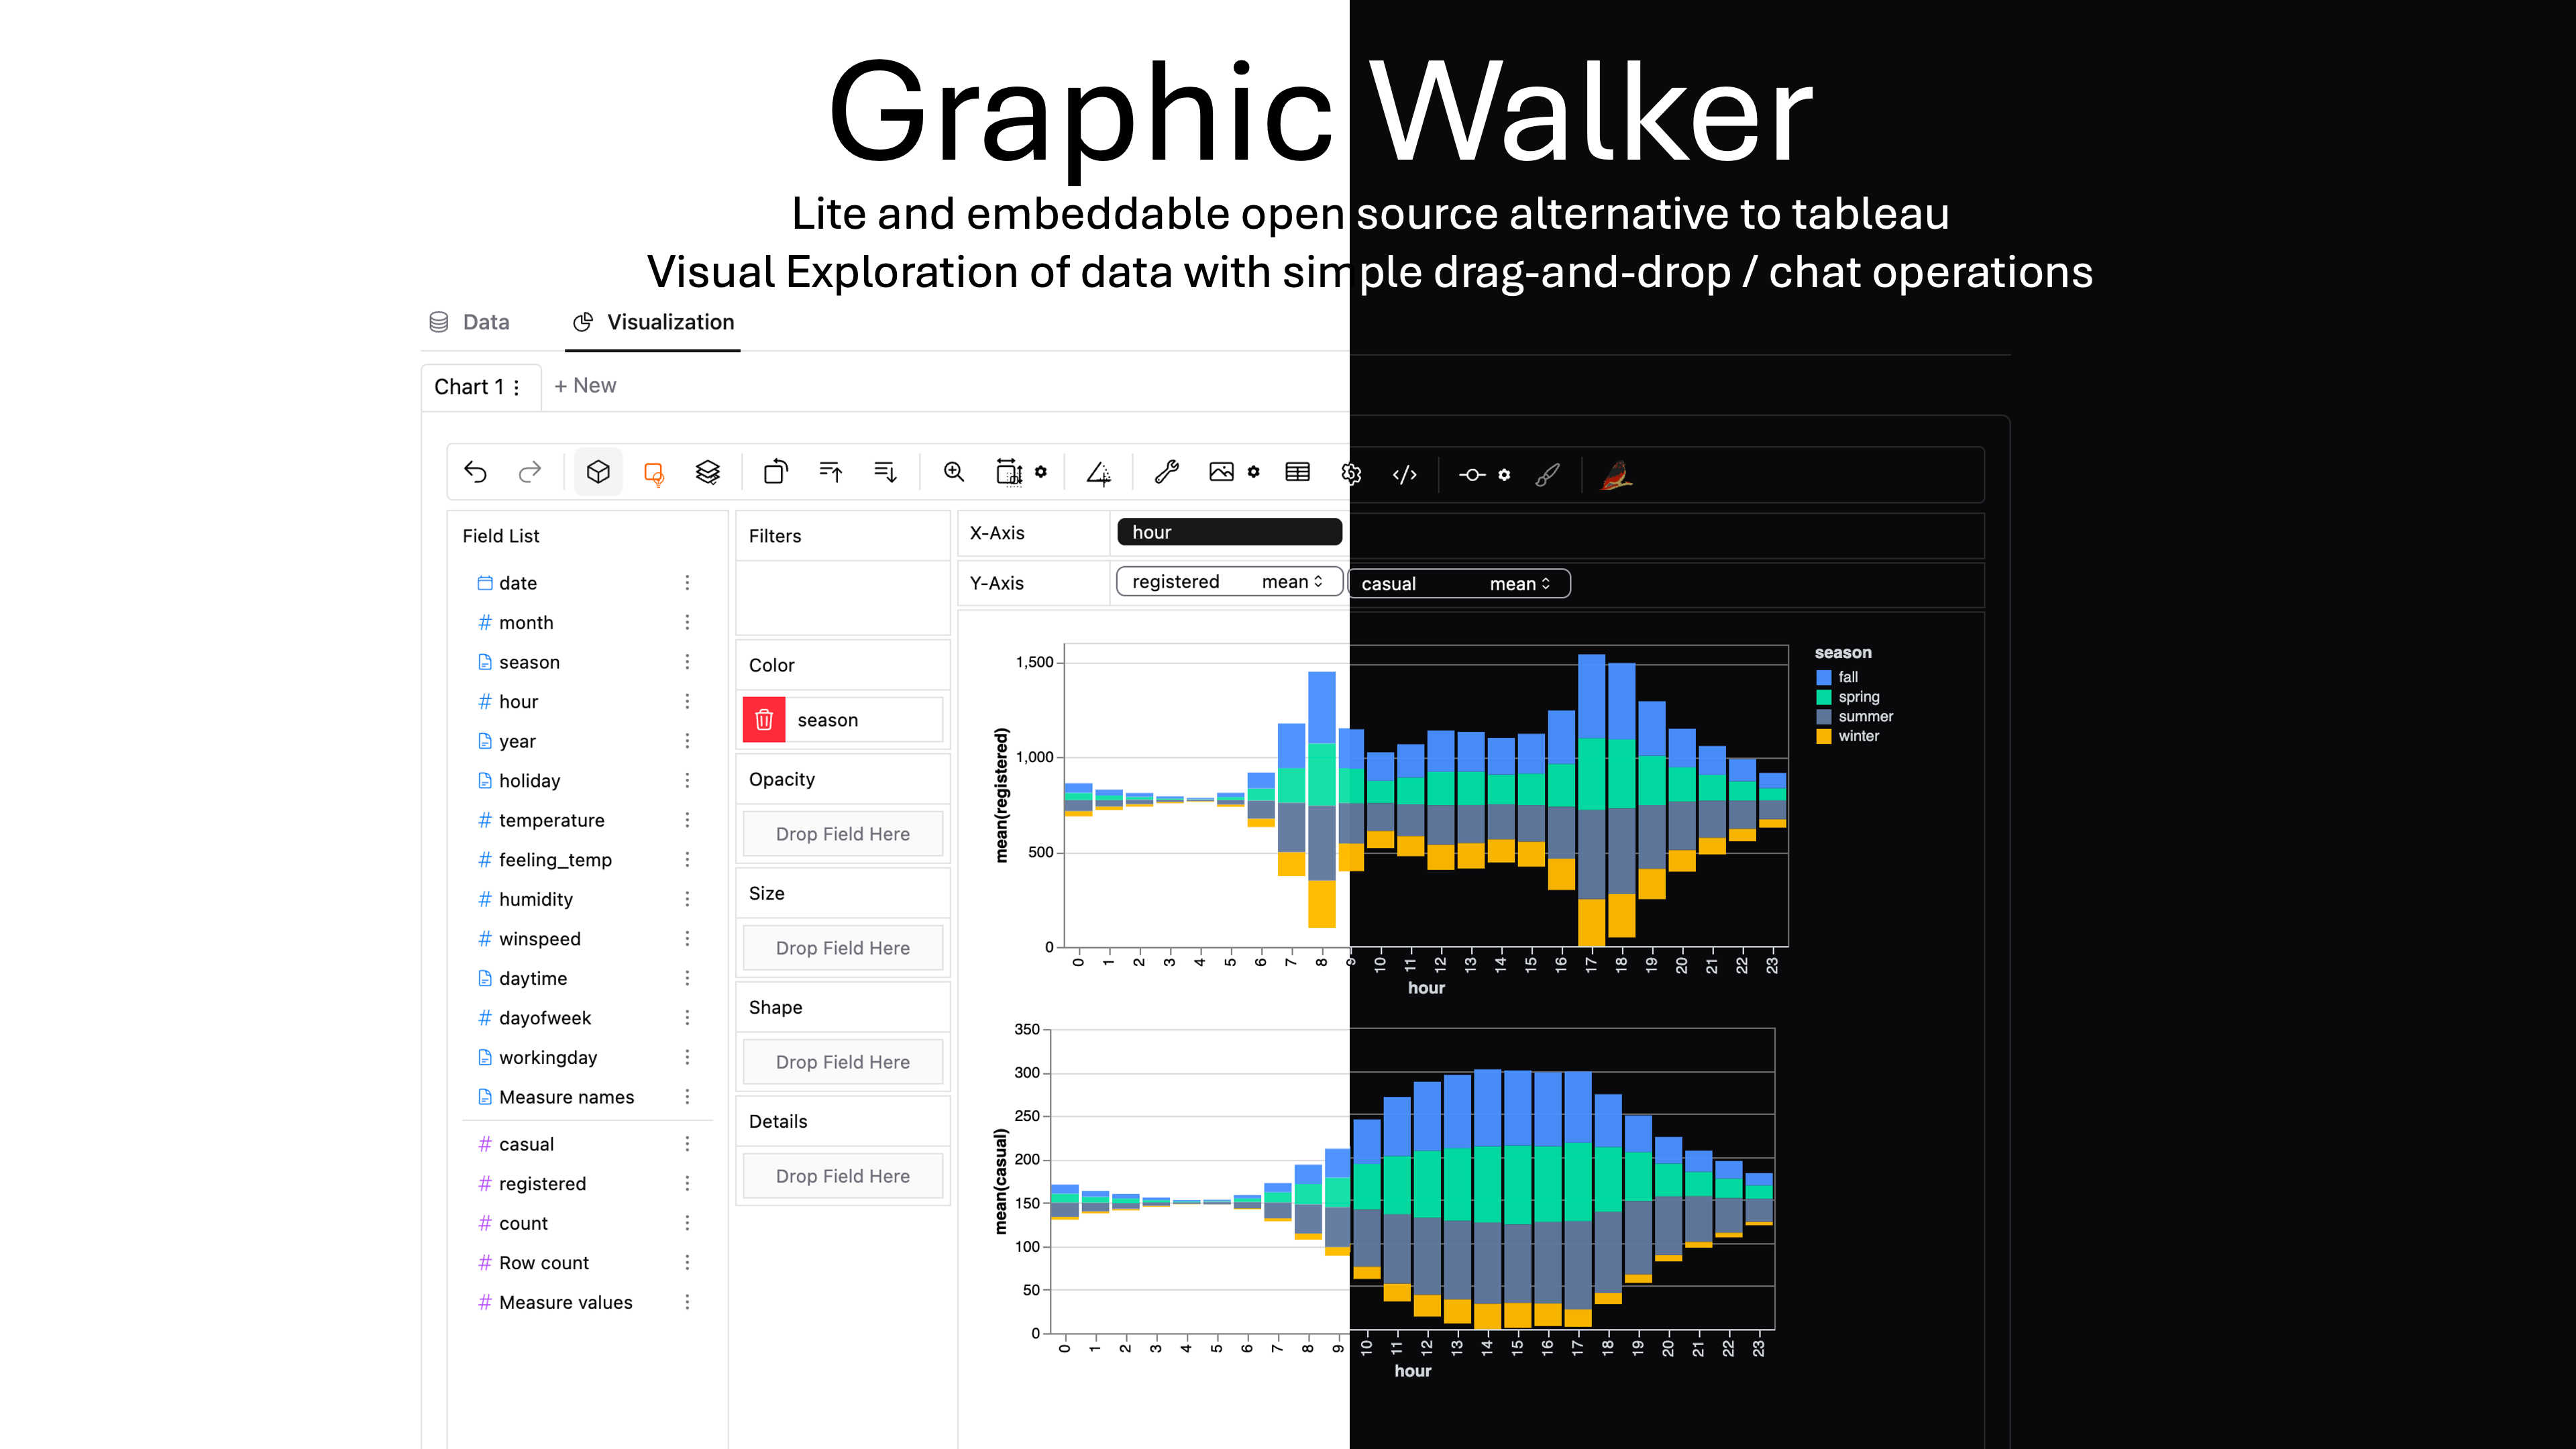
 graphic-walker-banner
PyGWalker Turn your data into an interactive UI for data exploration. It allows you to visualize your data with simple drag-and-drop operations. pygwalker-banner-gh
Rath An automatic Exploratory Data Analysis(auto-EDA) system which helps extract insights and generate charts and interactive dashboard. kanaries rath
lab2 AI generated data apps, building data apps with simple text prompts Comming Soon!

Social Media

Resources

Pinned Loading

  1. pygwalker Public

    PyGWalker: Turn your pandas dataframe into an interactive UI for visual analysis

    Python 14.3k 758

  2. graphic-walker Public

    An open source alternative to Tableau. Embeddable visual analytic

    TypeScript 2.7k 143

  3. Rath Public

    Next generation of automated data exploratory analysis and visualization platform.

    TypeScript 4.3k 348

  4. GWalkR Public

    Turn your data frame into a tableau style drag and drop UI interface to build visualization in R.

    TypeScript 455 45

Repositories

Showing 10 of 34 repositories
  • graphic-walker Public

    An open source alternative to Tableau. Embeddable visual analytic

    TypeScript 2,745 Apache-2.0 143 20 (3 issues need help) 0 Updated Mar 6, 2025
  • pygwalker-offline-example Public archive

    pygwalker offline example

    Jupyter Notebook 3 Apache-2.0 5 1 0 Updated Mar 6, 2025
  • pygwalker Public

    PyGWalker: Turn your pandas dataframe into an interactive UI for visual analysis

    Python 14,334 Apache-2.0 758 56 (4 issues need help) 3 Updated Mar 5, 2025
  • GWalkR Public

    Turn your data frame into a tableau style drag and drop UI interface to build visualization in R.

    TypeScript 455 Apache-2.0 45 13 0 Updated Jan 20, 2025
  • photes-io-obsidian-plugin Public

    AI Image to text notes plugin in obsidian

    TypeScript 2 2 0 0 Updated Dec 17, 2024
  • .github Public
    1 2 0 1 Updated Sep 10, 2024
  • Rath Public

    Next generation of automated data exploratory analysis and visualization platform.

    TypeScript 4,349 AGPL-3.0 348 51 (2 issues need help) 15 Updated Aug 20, 2024
  • Python 0 Apache-2.0 3 0 0 Updated Jul 31, 2024
  • pygwalker-in-streamlit Public

    build visual exploration app using pygwalker in streamlit

    Python 45 Apache-2.0 33 2 0 Updated Jul 30, 2024
  • pygwalker-streamlit-eda Public

    pygwalker + streamlit for EDA with latest updates

    Python 4 MIT 2 0 0 Updated Jul 7, 2024