Simple python script to visual Sense Energy consumption & solar generation on an LED matrix.
Uses a raspberry 3, leds, and python.
SENSE_TEST=True SENSE_USER="email" SENSE_PASSWD='5ecr!ts' sudo -E python3 src/main.py
stdout will see progess bars showing usage
|   |   |   |   |   |   |   |   |   |   |   |   |   |   |   |   |   |   |   |   |   |   |   |   |   |   |   |   |   |-X-|   |   |
|   |   |   |   |   |   |   |   |   |   |   |   |   |   |   |   |   |   |   |   |   |   |   |   |   |   |   |   |   |-X-|   |   |
|   |   |   |   |   |   |   |   |   |   |   |   |   |   |   |   |   |   |   |   |   |   |   |   |   |   |   |   |   |-X-|   |   |
|   |   |   |   |   |   |   |   |   |   |   |   |   |   |   |   |   |   |   |   |   |   |   |   |   |   |   |   |   |-X-|-X-|   |
|-X-|-X-|-X-|   |   |   |   |   |   |   |   |   |   |   |   |   |   |   |   |   |   |   |   |   |   |   |   |   |   |-X-|-X-|   |
|   |-X-|   |   |   |   |   |   |   |   |   |   |   |   |   |-X-|-X-|   |   |   |   |   |   |   |   |   |   |   |   |   |-X-|-X-|
|-X-|-X-|-X-|   |   |   |   |   |   |   |   |   |   |   |-X-|-X-|-X-|-X-|   |   |   |   |   |   |   |   |   |   |   |   |-X-|-X-|
|   |-X-|   |   |   |   |   |   |   |   |   |   |   |   |   |-X-|-X-|   |   |   |   |   |   |   |   |   |   |   |   |   |   |-X-|
|   |-X-|   |   |   |   |   |-X-|   |   |   |   |   |   |   |-X-|-X-|   |   |   |   |-X-|   |   |   |   |   |   |   |   |   |-X-|
From Solar:  -0%|          | -7.00/8.00k [00:00<-1:59:59, -7.09kwatts/s]
Consumption:  12%|█▏        | 1.74k/15.0k [00:00<00:00, 1.40Mwatts/s]
From Grid:  12%|█▏        | 1.75k/15.0k [00:00<00:00, 1.67Mwatts/s]
THis project includes the files needed to register this script as an always running daemon. THis will restart on crash or power loss.
- git clone this repo to your pi, using
/home/pi/sense-showas checkout dir will save editing files - Create a
.envfile in the checkout dir containing yourSENSE_USERandSENSE_PASSWD. - Optionally comment out the
git pullinstart.shif script should not auto update itself. - cd into
raspberrypidirectory, and confirm paths in senseshow.service, and runinstall.shthis will install python dependencies and register service with system daemon. - To test it run
sudo systemctl start senseshow.serviceand thensystemctl status senseshow.serviceand ortail -f /home/pi/sense-show/sense-debug.logto make sure everything works. - Unplug pi and plug it back in, wait ~30 seconds and confirm everythign started, if not, repeat last step.

I assume you have one if you're here, but if you're even a little interested they are a great investment for learning/tinkering, and you can get a full 3B+ rig for < $50 or a zero wireless for $25.
If wired to an LED strip you'll also visualize it. I bought a cheap serial style one on amazon.
8x32 LED Panel - Individually Addressable

I have Sense and love it, Schneider electric seems to be reselling as "Wiser Energy monitor" too

32x128 pixel monochrome screen

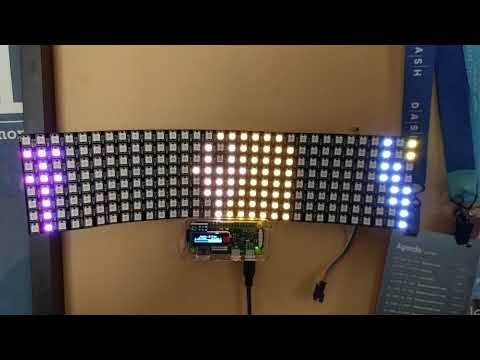
- Grid - depicted with tower on left
- Plug - depicted with electrical plug in center
- Panels - depicted by blue stripes on right
- Sun - Small yellow dot abov panels
- Energy Flow Green, Yellow or Red leds flow in the direction of energy, sized base on total watts.
Orange/Yellow LEDs will flow from panels, through house (reduced by usage) and back to grid. Shown here, these yellow LEDs are moving right (solar) to left (grid)

Red LEDs will flow from grid to house, and feeding panels during shade/night. For instance here my idle house is using minimum electricity and feeding about 8 watts to panels at night. Lights are moving left (grid) to right( house and panels)

- logging configured in the app writes to
sense-debug.log - stdout/stderr when running as a service can be obtained by
journalctl -u senseshow.service --since today(or remove date filter) - status, stop, start with
sudo systemctl <action> senseshow.service
If things seem slow, stale you shouldn set LOGLEVEL=DEBUG in the .env and also send a SIGUSR1 (i.e. kill -USR1 <PID>)
I also added live updates from a related project to use sense data to send generation and consumption data to pvoutput.org .
set these values in .env
PVOUTPUT_KEY="yourkeyfrom pvoutput.org"
PVOUTPUT_ID="siteid"
and then set a cron to run the pvoutput.py
*/5 * * * * python3 /home/pi/sense-show/src/pvoutput.py
